

HOT TOPICS LIST
- Strategies
- Stocks
- Buy
- Investing
- Brokers
- Psychology
- Interviews
- Accumulate
- Sell
- Hold
- Spotlight
- Websites
- Candlestick Corner
- Gold & Metals
- Options Trading
LIST OF TOPICS
Where Are The Real Investors?
07/21/04 04:43:04 PM PSTby James Kellndorfer
Increases in volume, prices, and supply? What's going on?
| Many investors and traders incorporate volume into their analysis to add another dimension to their projections. This technique was first practiced 70 years ago by technician Richard D. Wyckoff. However, all things must change, and it seems that the composition of trading volume on the New York Stock Exchange (NYSE) has also changed. But does today's volume truly represent demand?
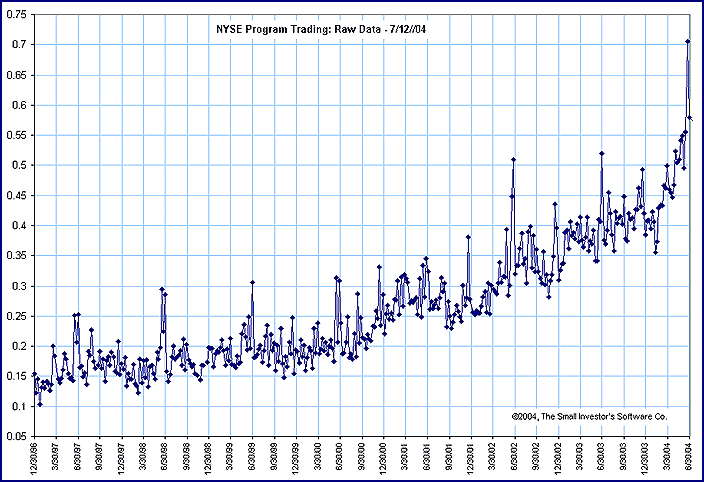
Let's find outIn June 2004, I watched, fascinated, as I saw history being made in NYSE trading, without fanfare or media coverage. It was the first time that program trading had exceeded 50% of the daily volume for two weeks in a row. But it didn't stop there! This high-program trading volume continued, exceeding 50% of the total trading volume on the NYSE for an entire month. During the week after June 2004's option expiration, program trading made up 70.5% of the week's trading volume. As of this writing, program trading volume has exceeded 50% of daily trading volume for six weeks. But what does this mean, and are there any consequences? I decided to explore and dissect the meaning of "demand," determined to identify whether the nature of the markets had changed permanently. The rising trend in program trading volume is clear in Figure 1. So the first statement to make is that the nature of investing has changed: the volume on the NYSE is now influenced substantially by program trading. Second, program trading must be quite profitable, or firms wouldn't have increased these activities.
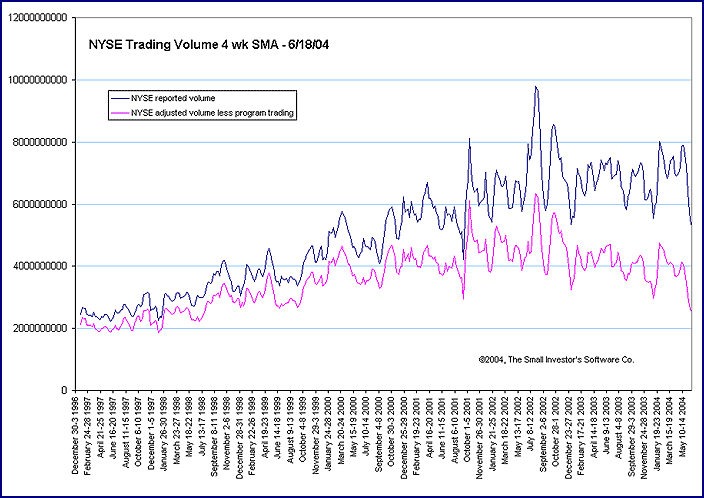
Figure 1: NYSE program trading as a percentage of total volume. What is program trading?We all assume that program trading is index arbitrage trading, but this only accounts for an average of 10% of all program trading volume (as reported by the NYSE). What about the other 90%? It's disturbing this 90% is classified by the NYSE as "other," implying that it's miscellaneous or trivial. How can 90% of any quantity be trivial? Are there so many program trading strategies being utilized today that they defy classification? If so, where's the book on program trading strategies? It appears that the majority of program trading is not well defined, nor identified to the average investor, and this lack of disclosure is a concern. After all, these trends affect all investors, and this amount of program trading affects how analysts should interpret price and volume. Figure 2 shows the four-week simple moving average of the NYSE's reported weekly volume (the official volume reported the day after trading, not the volume reported after the market closes) and the four-week simple moving average of the NYSE's reported weekly volume, adjusted to exclude the amount of volume attributed to program trading. First, notice that the rising trend in total volume uncouples from the adjusted volume around 2002. What was so special about 2002? That was the year the market put in its multiyear lows. Since then, the net trading volume is actually decreasing. Is "true" demand for stocks decreasing?
Figure 2: NYSE trading volume. Here's a comparison of NYSE total weekly volume versus the net volume after program trading volume is removed. A four-period simple moving average was used.
You will also note in Figure 2 that the gap between the total volume and net volume is widening. Back in 1997, the amount of program trading was only around 300 million shares a week. Now it totals three billion shares a week! Program trading has grown by a factor of 10, with rapid growth after the lows of 2002. This tremendous growth would only occur if it proved profitable. So what are the economics behind all of this program trading volume? If it's not related to index arbitrage, then what is it, and how is it changing the nature of trading?
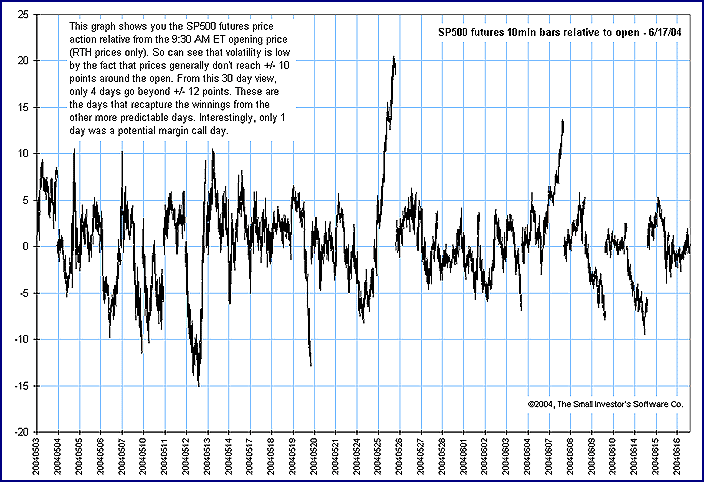
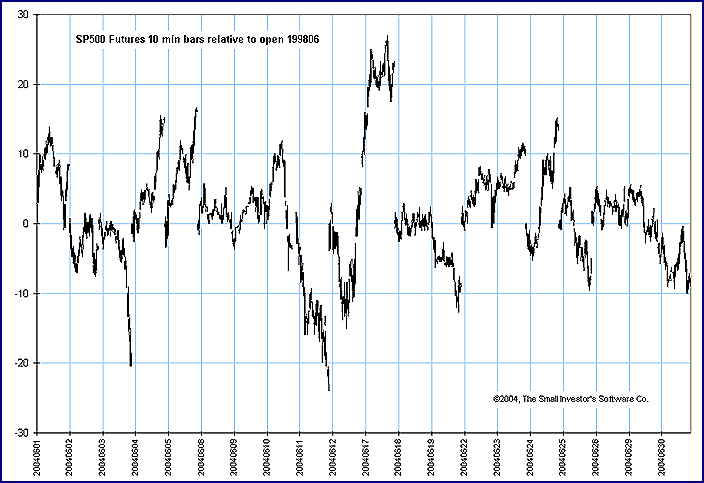
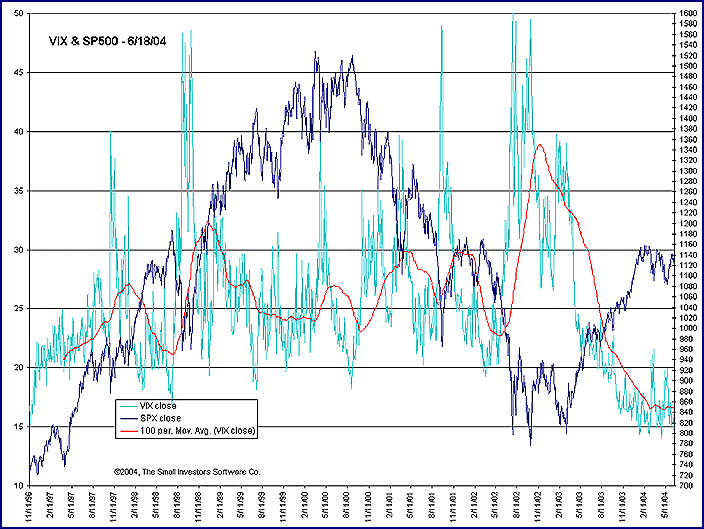
The effectsTo explore the effect of increased program trading from 300 million to three billion shares, I decided to compare the price action of June 2004 to that of June 1998. Essentially, I subtracted the opening price from all intraday prices and plotted the month's prices. What's remarkable is that the Standard & Poor's 500 prices were coincidentally in the same price range in 1998 and 2004, so a direct comparison of actual prices is possible without any mathematical conversions such as percents or logarithms. Figure 3 represents the intraday prices relative to the daily opening price from 2004. Figure 4 represents the intraday prices relative to the daily opening from June 1998. First, note that most days in 2004 have small ranges. Second, only one day out of 30 had a range of 20 points, and only eight days had ranges greater than 10 points. Contrast this with 1998, which had three days with ranges greater than 20 points and 12 days greater than 10 points. In addition, you can see that in 2004 the daily ranges are quite small compared to the trading ranges of 1998, and generally the ranges in 2004 are half those in 1998. As proof, compare the volatility of the Vix from 1998 to 2004, and you will also see that current levels of volatility are at historical lows (although not half of 1998's levels), as shown in Figure 5, despite these two periods' similar strong uptrends. From another perspective, 2004's annual point range is only 90 points, versus 323 for 2003, and although the year isn't over yet, this is creating the smallest annual range in 22 years.
Figure 3: S&P 500 futures intraday prices relative to the opening price of June 17, 2004. Volatility is rather low, since prices generally don't reach +/-10 points around the open. From this monthly view, only four of the days go beyond +/-12 points. These days recapture the winnings from the other, more predictable days. Interestingly, only one day was a potential margin call day.
Clearly, the increase in program trading has discreetly affected volatility, and this been overlooked by many in the industry. This creates an important concern: What if the amount of program trading suddenly drops? Prices will certainly be affected by the conspicuous loss of three billion shares, but precisely how is the great unknown. The purpose of program trading isn't defined, as most of the volume is classified as "other." The question then is, does this represent a different form of demand? Are the brokerage houses propping up the market? Are they accumulating shares and now distributing them? In that case, who is trading, and why is program trading increasing? It appears as though the big brokerage firms are taking the other side of all trades, and scalping dimes as billions of shares are being "flipped." If I hypothetically then conjecture that those firms involved in program trading yield only 0.1% per day, that small amount of profit at these high volumes totals nearly $2 billion annually. Investors the world over can't afford to lose this amount of money annually to this so-called inefficiency, particularly when the inefficiency isn't disclosed. This is the most cynical view, but in all seriousness, it raises the question of how we can use volume to measure the current "true" demand for stocks, when over 50% of the trading volume represents something other than what Wyckoff was measuring. In addition, AMG Data Services reports that the cash flow into domestic equity mutual funds is the lowest in 12 months, and on a year-over-year basis, the flow is lower than last year. So where's the fuel to drive prices higher? Prices ought to rise with increased demand, but in this case, where is that demand? The mutual fund data shows that it isn't from retail customers, so it must be due to a lack of supply, right? Well, the supply of stock in the S&P 500 increased by 6.28 billion shares in just 12 months (May 2003 to May 2004). This represents a 2.2% increase in supply in one year from the supply last year, but the float grew by even more (7.59 billion shares). So if companies were repurchasing their shares, in actuality, they didn't buy enough shares to decrease supply. This still leaves us with a net increase in supply over this period, but that isn't capping the rise in prices. If prices are rising due to forces other than supply and demand, then it becomes more important than ever to understand the scope and nature of program trading. More companies are issuing dividends, and Congress reduced tax rates on dividends in May 2003. This gave the markets a new value paradigm, which is responsible for the change in perception of value. But despite this new perception of value, how did prices rise against the basic laws of economics 101? How did supply and demand work in concert to push prices higher? Finally, where was the increase in demand to push prices higher? In summary, demand is decreasing if you compute demand as total trading volume less the amount of program trading volume. The amount of retail money flowing into the market is decreasing. Supply is increasing, and prices continue to rise. None of these forces explains the rise in prices. As a prudent speculator, I must ask: What would cause the loss of this type of trading or business? If we knew the answer, then I would be more prepared to assess the risk that this type of trading represents in my models. For now, I can only surmise that volatility will increase. Second, I'm wondering when the US market will return to obeying the laws of supply and demand. The ramifications of this realization are obvious, but identifying that moment when prices begin to become revalued isn't. In addition, it would be outstanding if the catalyst that restores order to the supply and demand equation could be identified.
James Kellndorfer is the founder of The Small Investor's Software Co., www.smallinvestors.com. Charts courtesy The Small Investor's Software Co.
Current and past articles from Working Money, The Investors' Magazine, can be found at Working-Money.com. |
| Company: | The Small Investor's Software Co. |
| Website: | www.smallinvestors.com |
Traders' Resource Links | |
PRINT THIS ARTICLE

Request Information From Our Sponsors
- VectorVest, Inc.
- Executive Premier Workshop
- One-Day Options Course
- OptionsPro
- Retirement Income Workshop
- Sure-Fire Trading Systems (VectorVest, Inc.)
- Trading as a Business Workshop
- VectorVest 7 EOD
- VectorVest 7 RealTime/IntraDay
- VectorVest AutoTester
- VectorVest Educational Services
- VectorVest OnLine
- VectorVest Options Analyzer
- VectorVest ProGraphics v6.0
- VectorVest ProTrader 7
- VectorVest RealTime Derby Tool
- VectorVest Simulator
- VectorVest Variator
- VectorVest Watchdog
- StockCharts.com, Inc.
- Candle Patterns
- Candlestick Charting Explained
- Intermarket Technical Analysis
- John Murphy on Chart Analysis
- John Murphy's Chart Pattern Recognition
- John Murphy's Market Message
- MurphyExplainsMarketAnalysis-Intermarket Analysis
- MurphyExplainsMarketAnalysis-Visual Analysis
- StockCharts.com
- Technical Analysis of the Financial Markets
- The Visual Investor