HOT TOPICS LIST
- Strategies
- Stocks
- Buy
- Investing
- Brokers
- Psychology
- Interviews
- Accumulate
- Sell
- Hold
- Spotlight
- Websites
- Candlestick Corner
- Gold & Metals
- Options Trading
LIST OF TOPICS
THE CHARTIST
Profiting In A Stage III Market
08/06/04 09:43:16 AM PSTby Melvin Pasternak
How can you make money in a trading-range market?
| Four-stage analysis was first defined by technician Stan Weinstein in his 1988 book Secrets For Profiting In Bull And Bear Markets. Although much has changed in the world of technical analysis since then, Weinstein's concepts are every bit as relevant today. As defined by Weinstein, four-stage analysis is primarily a long-term trading system (although he also applied the concept to shorter-term trading). The investor enters a stock as early as possible after it breaks out of the stage I basing area, rides the issue through the stage II advance, and gets out of the security during the formation of a stage III top, ideally well before a stage IV decline begins. While this method is intended to be a long-term strategy for capturing large bull and bear market swings, I use it for short-term trading. The four-stage analysis is my starting point for analyzing any chart, and vital for establishing the direction both of the overall market and of individual stocks.
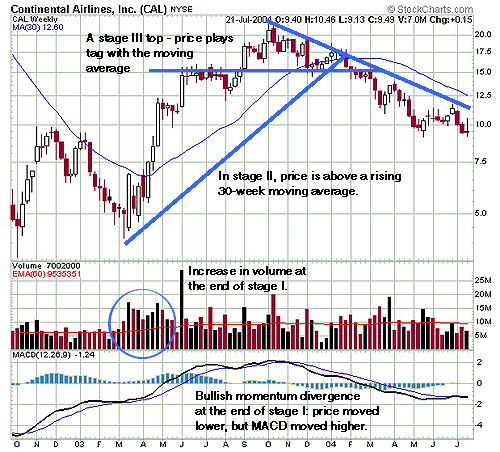
What stage is the market in?An index such as the Standard & Poor's 500 ($SPX), which is often taken as a proxy for the overall market, is judged in relation to its 30-week simple moving average (SMA). When the $SPX is below a rising or upward-sloping 30-week moving average, the market is in a stage II advance. Conversely, when $SPX is below a declining or downward-sloping 30-week moving average, the market is in a stage IV decline, and for the investor, the majority of stocks should be avoided or sold short. In stages I and III, the market is moving sideways, playing "tag" with its moving average. These markets are best suited to short-term traders, although long-term investors should be alert for buying opportunities in stage I or to take profits in stage III. The chart of Continental Airlines (CAL) in Figure 1 illustrates all four stages. The chart begins in April 2003 with CAL in the midst of a strong stage IV decline. During this time, the stock was in sync with the overall market, which was also in a strong bear market or declining phase. During its stage IV decline, CAL consistently traded below its downward-sloping 30-week moving average. It was not until January 2003 that a rally brought the stock up to the moving average near $10; then it failed rapidly, resulting in large paper losses for anyone who bought at the wrong time.
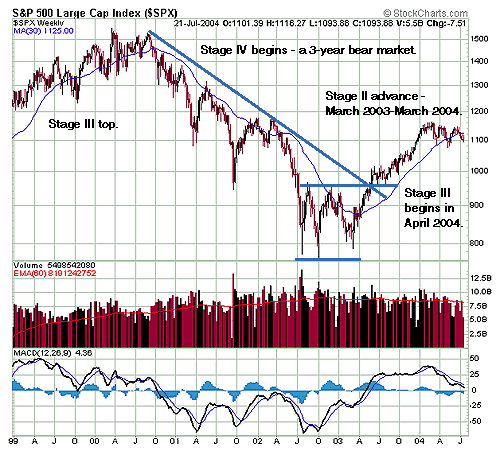
Figure 1: The four stages. Here you see a classic example of the four different stages of stock price movement. According to my analysis, stage I ends in early April 2003 when the stock breaks a downtrend line. The stage I base takes the shape of a triangle. Note the strong increase in volume in late March 2003 as the stock bottomed. This is often a clue that a stage I bottom is being formed. Although Weinstein did not include indicators in his book, these tools combine well with basic four-stage analysis. I've added a moving average convergence/divergence (MACD) indicator to the chart. Note how the bullish momentum divergence was providing advance warning for several months that the decline was coming to an end. Stage II in CAL began when the stock started to trade above an upward-sloping 30-week moving average in early April 2003. Ideally, a stage II breakout is accompanied by high volume. This rising price on rising volume indicates that investors are willing to pay up to own the stock. An alert investor would have entered CAL at approximately $8. As with all trend-following systems, four-stage analysis does not allow you to enter at the bottom or sell at the top. However, it does very well at catching the middle slice of a trend and protecting those who apply its concepts from large losses. The stage II advance lasted from $8 in April 2003 to approximately $15 in November 2003, nearly doubling in eight months. During this time, CAL remained consistently above a rising 30-week moving average — the signature of the stage II advance. Even when CAL went sideways for several weeks during the May to August period, the moving average continued to rise. Note that during the mature part of the trend, the moving average and trendline run parallel to one another. I find that this is often the case and that the 30-week moving average, of all moving averages, best mimics the long-term trendline. (In fact, in my experience, the 30-period average works best to describe the trend no matter what the time frame, be it a five-minute chart, hourly, daily, or weekly.) The stage III topping process lasted several months and took the form of a head & shoulders pattern. Note how during the later state of stage III, CAL went both above and below its 30-week moving average for a short period. Eventually, in March 2004, the stock traded below its sideways-sloping 30-week moving average. In late March, just as the overall market was topping out, the 30-week moving average on CAL began to slope downward, indicating a stage IV decline. Weinstein advises never to buy a stock in a stage IV decline. It may look cheap compared to its former price, but is apt to get a lot cheaper as time goes by. As the chart ends, CAL is clinging to support near $10 and is in a strong stage IV decline. An important starting point for all short-term trading is to be clear at what stage the overall market is in. Take a look at the chart of the S&P 500 in Figure 2. The chart goes back to late 1999, as the index was beginning to roll over into a stage III top after a long bull market advance. Each box on this chart represents three months of trading action. The stage III topping process lasted from about July 1999, when the S&P first broke below the 30-week moving average, to September 2000, when it finally started to trade consistently below it. Clearly, stage III tops can take a long time to form! Also of interest is that while weekly MACD gave a number of buy and sell signals during this time, it stayed consistently above its own zero line. The break below the zero line occurred just after the index entered stage IV. As I write this in mid-July 2004, MACD is hovering just above the zero line as well.
Figure 2: What stage is the market in?
Note that for virtually the entire bear market (late 2000 to early 2003), the S&P traded below the declining 30-week moving average. On the few occasions that the S&P went above the moving average, the moving average itself continued to slope downward (except for a very brief period in late 2002). Finally, after one of the longest bear markets since the 1930s, the S&P completed a stage I triple bottom reversal formation in March 2003 when it broke out above 960, a level at which it simultaneously broke the bear market downtrend line going back to 2000. From here, the index remained above its rising 30-week moving average until March 2004, when for the first time in more than a year, it traded below. As of mid-July 2004, the index is once again below its 30-week moving average, and the moving average is beginning to move sideways. This tells me the market has entered a stage III topping phase, which is likely a prelude to a stage IV bear market. The index is once again below its 30-week moving average for the second time in 10 weeks. While a stage III market can conceivably turn back into stage II, this is less probable than its turning into a stage IV decline, since it would take a strong surge of buying to turn the moving averages positive again. A stage III market can also be very frustrating for both traders and investors. Prices go into a trading range, with the market contained within tight support and resistance levels. For almost all of June 2004, for example, the S&P was bound by 1122 support and 1146 resistance. How can short-term traders make money in a trading-range market? One solution is to identify two kinds of stocks: those already in stage IV and those still in stage II. True, the majority of stocks mirror the market and are in stage III. However, those already in stage IV may be thought of as downside leaders, ahead of the market. They have weak relative strength compared to the S&P. Stage II stocks, on the other hand, continue to outperform the market. They are evidence that an entire market does not top at once, but rather sector by sector and even stock by stock.
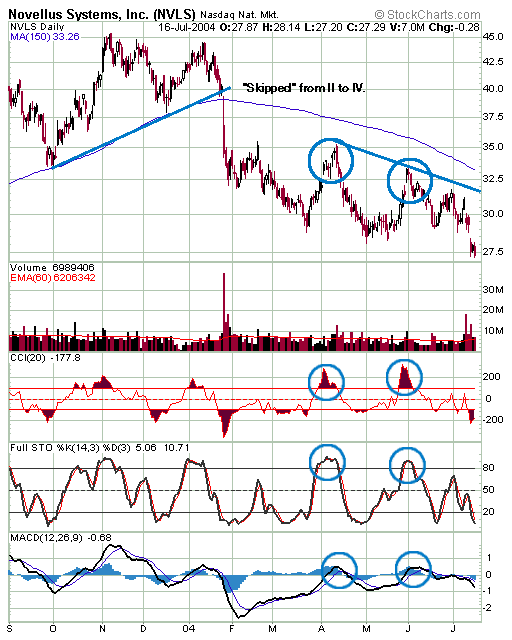
Stage II and stage IV stocksA trading system can be based on finding stage II and stage IV stocks and taking action when they become overbought or oversold. For this system, I use only three indicators: stochastics, the commodity channel index (CCI), and moving average convergence/divergence (MACD). I look for high-probability, short-term opportunities. While the signals are not all that frequent, if you apply this method to a variety of stocks, it creates frequent trading opportunities. One example of a stage IV stock is Novellus (NVLS), which is in the technically weak semiconductor index ($SOX — Figure 3). For this discussion I have used a daily chart with a 150-day moving average (the approximate equivalent to the 30-week) to identify short-term trading opportunities. Novellus formed a double top near $45 in late 2003. It broke decisively below its 150-day moving average in late January, beginning its stage IV decline well before the overall market.
Figure 3: A stage IV stock
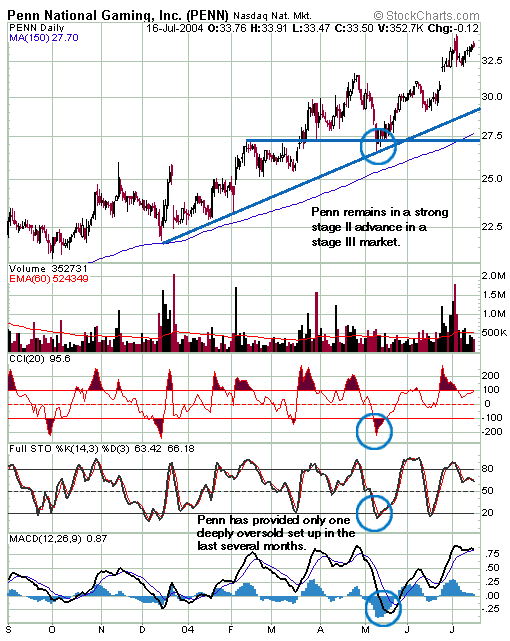
You should never short stage IV stocks willy-nilly. When a stage IV stock moves a large distance below its 150-day moving average, it is very oversold and liable to rally because of other market participants' bargain hunting and short covering. Instead, the short-term trader should wait until the stage IV stock is very overbought and begins to turn. Traditional overbought indicators such as stochastics and CCI can be used to identify overbought stocks in a major downtrend or stage IV decline. A sell signal on the slower MACD indicator confirms that the stage IV stock is retreating from overbought levels. A stop should be placed just above the high price on the day of the MACD signal. Using this strategy, NVLS had two clear short setups: one in early April, and a second in early June 2004. Both trades were highly profitable. The short should be covered when both stochastics and CCI give a buy signal, but before MACD issues a sell (to protect profits). Penn Gaming (PENN) in Figure 4 illustrates a stock in a stage II advance. Here the trading strategy is the opposite: The short-term trader waits for bounces from oversold levels, as marked by stochastics and CCI. The MACD buy signal initiates the trade, and the stop is placed just below the low price of the day of the signal. Once again, take profits when stochastics and CCI both turn down from overbought levels. This strategy yielded a profitable trade in late May 2004.
Figure 4: A stage II advance
Make that trade workThe signals generated by this technique are high probability but relatively infrequent. To solve that problem, I apply this system to a large number of stocks. While stocks remain in stage II and stage IV for long periods, they oscillate between overbought and oversold. Periodically, I go through the database of approximately 750 stocks that I watch closely and classify them into stage II and stage IV patterns. I also monitor them daily for overbought and oversold opportunities. Identifying stage II and IV stocks in a stage III market, and combining this concept with overbought-oversold analysis, can help you beat the trading-range blues. It is one way to wring short-term profits out of a difficult market.
Melvin Pasternak has been a student of technical analysis since the 1970s. He has taught technical analysis courses at T.D. Waterhouse since the early 1990s, and also taught stock market analysis at the college level. Pasternak writes and edits for the StreetAuthority Swing Trader, a twice-weekly short-term trading newsletter published at www.streetauthority.com. He can be reached at melvinp@streetauthority.com.
Suggested readingWeinstein, Stan [1988]. Secrets For Profiting In Bull And Bear Markets, McGraw-Hill Professional Publishing.
Current and past articles from Working Money, The Investors' Magazine, can be found at Working-Money.com.
|
| E-mail address: | melvinp@streetauthority.com |
PRINT THIS ARTICLE

Request Information From Our Sponsors
- StockCharts.com, Inc.
- Candle Patterns
- Candlestick Charting Explained
- Intermarket Technical Analysis
- John Murphy on Chart Analysis
- John Murphy's Chart Pattern Recognition
- John Murphy's Market Message
- MurphyExplainsMarketAnalysis-Intermarket Analysis
- MurphyExplainsMarketAnalysis-Visual Analysis
- StockCharts.com
- Technical Analysis of the Financial Markets
- The Visual Investor
- VectorVest, Inc.
- Executive Premier Workshop
- One-Day Options Course
- OptionsPro
- Retirement Income Workshop
- Sure-Fire Trading Systems (VectorVest, Inc.)
- Trading as a Business Workshop
- VectorVest 7 EOD
- VectorVest 7 RealTime/IntraDay
- VectorVest AutoTester
- VectorVest Educational Services
- VectorVest OnLine
- VectorVest Options Analyzer
- VectorVest ProGraphics v6.0
- VectorVest ProTrader 7
- VectorVest RealTime Derby Tool
- VectorVest Simulator
- VectorVest Variator
- VectorVest Watchdog


