HOT TOPICS LIST
- Strategies
- Stocks
- Buy
- Investing
- Brokers
- Psychology
- Interviews
- Accumulate
- Sell
- Hold
- Spotlight
- Websites
- Candlestick Corner
- Gold & Metals
- Options Trading
LIST OF TOPICS
Simply Profitable
08/07/04 09:52:00 AM PSTby Austin Passamonte
Here's how one trader learned to trade by keeping it simple.
| Like many of you, I have scoured Working Money's sister magazine, Technical Analysis of Stocks & Commodities, cover to cover for nigh on two decades. Through the years, I've read literally hundreds of informational articles covering aspects of trading financial markets from very simple technical analysis to complex techniques. I've come to the conclusion that each trader is best suited for a certain few methods or approaches.
Something for everyone, everyone for somethingIndividual traders are unique in how they think, feel, and (above all) react. Thousands of potentially profitable ways exist to trade any financial market, and that is essential for the myriad personalities involved. I have the utmost respect for any trader who develops, finds, purchases, or otherwise discovers a viable trading system or method and, most important, makes it work in real-time trading with real money. There are quantum differences between mathematical theory and bottom-line performance results in someone's trading account. I'll assume most of us trade for the money, although that's not true for all. If those of us who are truly motivated by money are to realize those fiscal goals, we must each find our own way of wresting methodical profits while avoiding debilitating loss.
Is less more for most?We all need a trading system or method that cuts losses short, lets profits run, and maintains a profit/loss ratio in positive balance with our win/loss percentage. Right or right? During live market action and in the heat of our emotional struggles, the less we have to think about and factor in our minds, the faster we can make decisions and act upon them. Systematic traders who let software dictate entry, exit, and stop-management activity have the least amount of thinking to do on which to base trade decisions. Discretionary traders who watch four different time frame charts plastered with 37 different indicators across six various market symbols might be bordering on information overload. I placed my first trade in corn futures back in April 1984, so I've been around financial markets for more than 20 years. In that time I've traded commodities, stocks, options, stock index futures and options, bond futures, and foreign exchange markets. Along the way, I used some trading methods that relied on two or three time frame charts and five to 10 different technical indicators and signals. Truth is, I've come nearly full circle. These days, I actively trade stock index futures and forex spot currency markets using one time-frame charts and a couple of basic technical indicators. I have discarded and no longer use all of the following studies and perhaps a few more:
As I've previously noted, the list of technical studies I currently trade with is a lot shorter. There is nothing wrong with any of the market studies I've listed on their own or in combination with others; it's just that I discovered those studies either failed to help me make money, or in some cases, prevented me from making money.
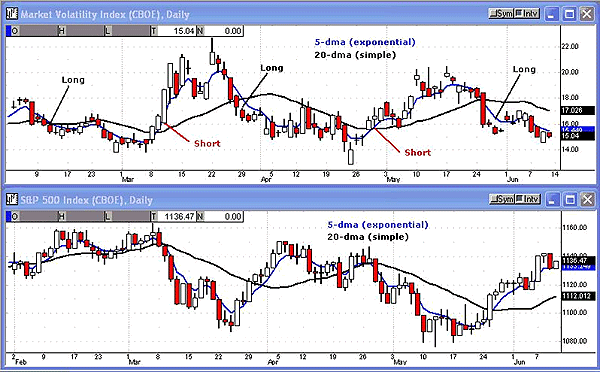
A simple systemApplying just two moving averages to daily charts of the CBOE Volatility Index (VIX) and Standard & Poor's 500 index (SPX) allows you construct a simple but robust trend indicator (Figure 1). More often than not, staying on the correct side of the market trend is (obviously) one key to long-term profitable success. What if we merely adhered to the following basic rules for swing trades in the S&P?
Figure 1: A simple trading system. Using a moving average crossover system on the CBOE Volatility Index (VIX) yielded rather flat results.
Go long when the VIX daily-chart five-period moving average crosses below the 20-period moving average with price action below both.
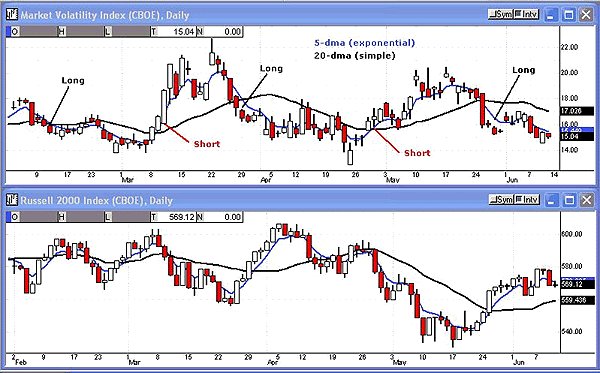
In these chart examples in Figure 1, there are five different trade entry signals between February and June 2004. I would consider overall price action to be rather flat inside a modest, rolling range. Highs near 1160 with lows around 1080 through this four-month period is comatose compared to recent years we have traded through, so activity of price moves of 80 points higher or lower for the S&P 500 inside of one week or even a couple sessions was not unusual. VIX levels above 30 and on a few occasions above 60 were much more common than sustained levels below 18 that have persisted for the past year or so. But we don't trade history on the left side of charts; we make (or lose) money in the now. In times past, I would have sought bullish stock index trades when VIX levels were below 20 and sought bearish stock index trades when VIX levels were above 30+. Along the way, I learned that high VIX levels can indeed go much higher while low VIX levels can creep into the bottom edge of the chart. Rather than try to time price turns by guessing highs and lows in VIX readings, I learned that trend trading using moving average values works more consistently for me. This method does not catch any market tops or bottoms, but I've never been able to do that on a consistent basis in any market for several years straight. The moving average values (lengths) selected for this example might not necessarily be an optimum pair. You could easily apply combinations of 9-18, 10-20, 15-30, or any other pair to come up with roughly similar performances. Your focus should not be trying to winnow down the most optimum settings, which is probably curve-fitting to any specific period of market action studied. The idea here is to identify and use some type of market filter to trade in real time, with real money, under real market conditions. Naturally, you would expect S&P index action to respect VIX level readings since they are directly related. But what about other stock index markets? Much of 2004 I've personally traded the Russell 2000 emini market compared with others. Why? It tends to move more methodically across greater intraday ranges than the program trade-riddled ES or NQ markets (Figure 2).
Figure 2: Same story, different index. There's not much of a difference when applying the crossover technique to the Russell 2000.
As for daily chart swing trade entry signals, using price/MA-value action in the VIX gives similar positive performance as trading the S&Ps. Actually, with the Russell 2000 emini contract valued at $100 per index point versus S&P emini at $50 per index point movement, there is considerably more dollar-value profit potential in this chart than the S&P offered — same story, different index. The daily chart examples shown so far are nothing unusual, nor were they cherry-picked to support a temporary market condition. Feel free to drag similar charts backward in time and see for yourself if these relationships persist. I've done hundreds of hours in actual chart studies myself; I also realize your mind will believe what your eyes see more than what I suggest. It's human nature at work!
The law of (moving) averagesShort-term swing and intraday traders operate inside a smaller zone of potential profit per trade than long-term swing or true trend traders do. That requires more precision on entry, stop-loss, and profit target exits to be successful over time. Through the years I've accumulated more than 100 books on every aspect of short-term trading and read most of them, while a few lost my interest right away. Nonetheless, I found all of them valuable. Like many of you no doubt have done, I purchased more than 20 system packages from vendors and attended my fair share of trading seminars. Of the numerous methods I've researched for discretional trade decisions, I prefer something based on moving average values.
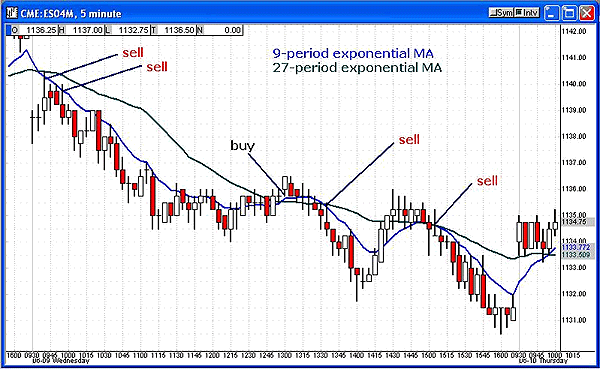
Buy strength, sell weaknessI'll be the first to admit that trying to trade moving average crossover entries in the traditional sense has never worked for me. Such a simple approach works great inside trending sessions but will carve a trading account into pieces on days when price action swings or chops sideways (Figure 3). Admittedly, the methods I use to trade with today have a few more components than two moving averages on a chart, but it is the basis of a sound and profitable approach.
Figure 3: Trends and trading ranges. A moving average crossover trading method works well during trending markets but only produces modest results in a trading range.
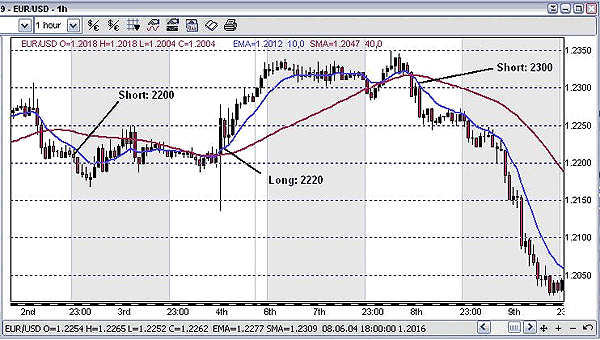
As a very active forex market trader, I find that discretionary trade methods based on moving averages work well. An average series of sessions in the euro/US dollar FX market shows where buying and selling moving average value crossovers offered potential profits of +50- to +250-pip maximum gains (Figure 4). Rather than concerning myself trying to time price reversal entries at supposed resistance or support, it is much easier in real time to manage capital (and emotions) by selling weak charts and buying strong ones.
Figure 4: Trends and the forex market. Moving average crossovers work exceptionally well in the EUR/USD market.
At the risk of being repetitious, I have the utmost respect for any trader using a market study, whether single or in combination, to wrest more profits out of a given market than it takes back. After nearly two decades of piling on indicator after market study searching for the secret of timing tops and bottoms, I have learned to trade with the flow. Basing a simple method or system on moving averages with perhaps a couple key filters added in reduces the amount of thinking (or feeling) required to place and manage trades. In the end, the secret of success in our profession is the ability to win enough percentage of profitable trades that allows the corresponding profit/loss ratio to result in a net profit after all expenses. Correct balance of any sustained win/loss ratio to profit/loss ratio is the foundation of long-term success. Designing a simple approach to managing trades from open to close that yield an acceptable win/loss ratio can be done with basic technical tools. And that is certainly good news for those of us who prefer to keep things as simple as possible! Austin Passamonte has traded futures, stocks, and equity options markets since 1984. Currently, he is the founder and editor of CoiledMarkets.com, a trader's advisory and educational website service. He may be reached at austinp@coiledmarkets.com. Current and past articles from Working Money, The Investors' Magazine, can be found at Working-Money.com.
|
Austin Passamonte is a full-time professional trader who specializes in emini stock index futures, forex, and commodity markets. His trading approach uses proprietary chart patterns found on an intraday basis. To find out more about Passamonte's work, visit www.coiledmarkets.com.
| Website: | www.CoiledMarkets.com |
| E-mail address: | austinp@coiledmarkets.com |
PRINT THIS ARTICLE

Request Information From Our Sponsors
- StockCharts.com, Inc.
- Candle Patterns
- Candlestick Charting Explained
- Intermarket Technical Analysis
- John Murphy on Chart Analysis
- John Murphy's Chart Pattern Recognition
- John Murphy's Market Message
- MurphyExplainsMarketAnalysis-Intermarket Analysis
- MurphyExplainsMarketAnalysis-Visual Analysis
- StockCharts.com
- Technical Analysis of the Financial Markets
- The Visual Investor
- VectorVest, Inc.
- Executive Premier Workshop
- One-Day Options Course
- OptionsPro
- Retirement Income Workshop
- Sure-Fire Trading Systems (VectorVest, Inc.)
- Trading as a Business Workshop
- VectorVest 7 EOD
- VectorVest 7 RealTime/IntraDay
- VectorVest AutoTester
- VectorVest Educational Services
- VectorVest OnLine
- VectorVest Options Analyzer
- VectorVest ProGraphics v6.0
- VectorVest ProTrader 7
- VectorVest RealTime Derby Tool
- VectorVest Simulator
- VectorVest Variator
- VectorVest Watchdog


