HOT TOPICS LIST
- Strategies
- Stocks
- Buy
- Investing
- Brokers
- Psychology
- Interviews
- Accumulate
- Sell
- Hold
- Spotlight
- Websites
- Candlestick Corner
- Gold & Metals
- Options Trading
LIST OF TOPICS
TRADER'S NOTEBOOK
Short-Term Trading
08/18/04 01:25:42 PM PSTby Steven Palmquist
When the market's not favorable for longer-term trading, you may want to consider short-term trading techniques as a way to generate profits.
| When I meet another trader, often I ask what type of trading they do. The typical answer is something like, "I'm a long-term trader" or "I'm a swing trader." The conversation then usually turns to current market conditions and whether the current market is "good" for trading. If market conditions are "bad," the trader either talks about holding off trading until conditions improve, or about the importance of sticking with a system and "riding out" the drawdowns.
Tools of the tradeWhen the market environment is not favorable for longer-term trading techniques, you could consider short-term trading techniques as a way to generate profits. A well-rounded trader needs tools for trading in up markets, down markets, trending markets, and sideways markets. Successful trading requires a variety of strategies that work in different market environments and a technique for selecting the most appropriate strategy for the current market conditions, as outlined in my previous article, "Trading Market Conditions." If you have a limited toolbox, you may find yourself sitting on the sidelines, or worse, experiencing drawdowns for extended periods of time. If you trade only long or only short positions, you are limiting yourself to only trading in certain market conditions. This may also be true if you focus exclusively on swing or intermediate-term trading techniques. Once you have a toolbox to produce setups for different types of markets, the next step is to vary your trading style — long-term, swing, or short-term — based on market conditions. Intermediate- or long-term trading works best when the market is in a clear trend. Swing trading works best when the market is oscillating in a wide base, or trending. Short-term trading techniques may be used in narrow or wide bases and in trending markets. It is generally best to use the longest-term technique that the current market conditions allow.
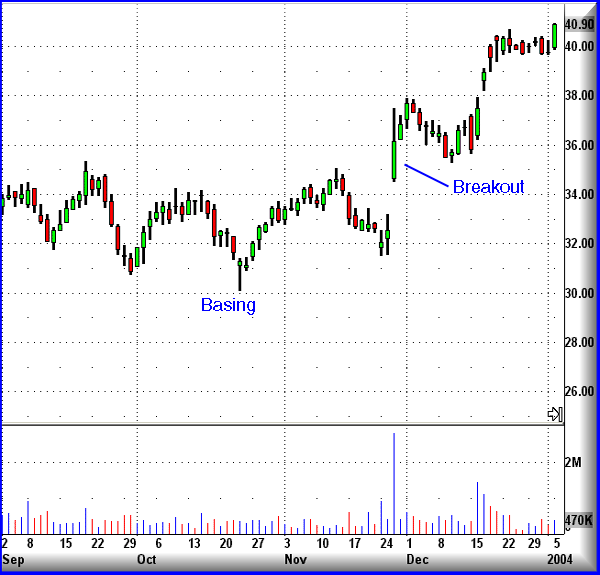
Trading breakoutsShort-term traders typically play the initial breakout period and sell after a few days, or after a small dollar or percentage profit target. The holding period and profit targets will vary depending on market conditions. For example, in 1999 short-term traders could hold for two to four days or a $5 to $7 profit; in the current market, it's more like one to two days and a $1 to $1.50 profit. Since many breakouts will retest the breakout area, short-term traders will rarely hold these positions longer than a few days. Short-term traders try to make a little money on each trade when the market is choppy or uncertain. Figure 1 shows a base breakout. After basing during the fourth quarter of 2003, TECD breaks out and moves about three points above the top of the base, retraces to retest support at the top of the base, then moves up again. According to Thomas Bulkowski's Encyclopedia Of Chart Patterns, this type of pattern pulls back to retest the base about 53% of the time, and the average time for completing the pullback is 11 days.
Figure 1: TECD base breakout and retracement.
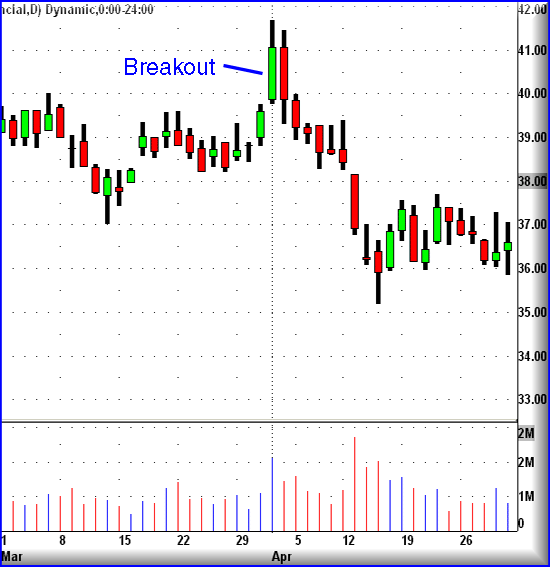
There are at least two ways to trade this breakout. Short-term traders would focus on capturing the initial thrust of the breakout. Swing traders would place a stop just inside the base and give the pattern more time to develop. In case of a successful retest of the breakout, swing traders usually come out ahead of short-term traders. As I've noted previously, when market conditions are strong, swing trading is generally preferred over short-term trading. In addition, keep in mind that sometimes these breakouts fail. In Figure 2, FNF breaks out of a two-month base, and then immediately falls back into it. In this case, swing traders would have been stopped out for a loss, and short-term traders would have had an opportunity to make a quick profit. Short-term trading can yield better results than swing trading in an environment where breakouts are likely to fail.
Figure 2: Base Breakout Failure.
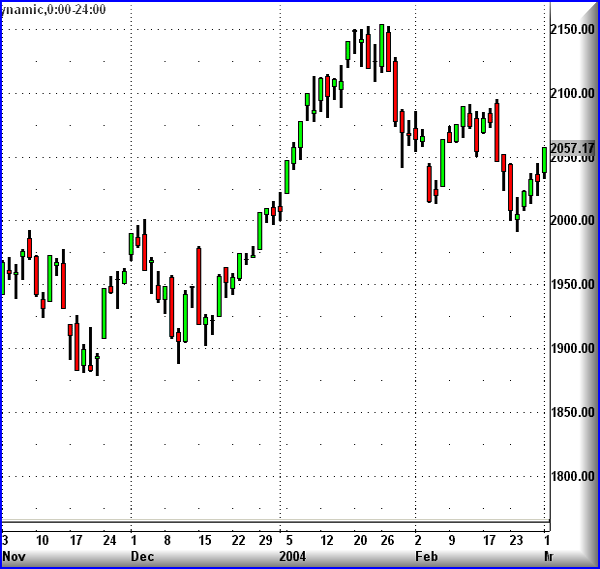
I generally use short-term techniques when the market is trading in a narrow range, or after an extended run when the market is either overbought or oversold. Breakouts have a high failure rate during these conditions, and I focus on taking quick profits after the initial moves rather than waiting to see if the breakout might be successful. Short-term trading is not daytrading. It is adapting holding periods to the market environment to capture quick profits on the initial move. I don't want to let a quick profit get away in an environment where breakouts are unlikely to have sustained moves. In Figure 3 you see a chart of the Nasdaq Composite during the fourth quarter of 2003 through the first quarter of 2004. Short-term trading was more effective than swing or intermediate-term trading during the narrow range trading the first half of November and the first part of February. I also switched from swing trading to short-term trading in mid-January after the market had a nice run and was showing signs of being overbought.
Figure 3: Nasdaq (October 2003-April 2004). Typically, when a market is overbought, swing trading becomes more risky. An overbought market can, and often does, become more overbought, but the situation is usually relieved through a retracement or a basing period. Either of these moves would make swing trading difficult, so in such scenarios, switching to short-term trading techniques lessens the risk of giving back hard-won profits.
Know when to closeShort-term trading requires quick, decisive action. It's generally a bad idea to wait for a stop to take you out of a position. Knowing when to exit is the hardest part of this game. I have developed some guidelines that have proved to be helpful in knowing when to get out:
A short-term trader needs a clear understanding of how the market typically behaves in different situations, and the ability to understand how the market is likely to react at key levels. No one reads the market correctly all the time, but it is possible to get good enough at it to improve the odds. Until this is a well-practiced skill, it's a good idea to work with someone who has experience in this area.
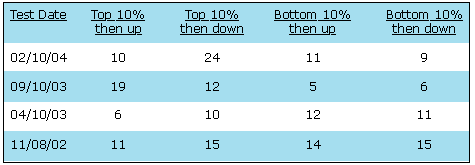
A look at statisticsTrading is a statistical game, and you want the odds on your side. In the 100 trading days prior to February 10, 2004, the Nasdaq was up 54 days — roughly a coin toss. However, it was up four or more days in a row only three times. In the 100 trading days prior to September 10, 2003, it was up 55 times, but up four or more days in a row only five times. I conducted this test back to the end of 1999 in 100-day increments and found that the probability of the Nasdaq being up four or more days in a row is 5% or less. This implies that if you are short-term trading, you should have clear reasons for entering a new long position after the market has been up three days in a row. Some traders have been taught to enter short-term trades at the end of the day when it looks as if the market is going to close in the extreme top or bottom of the range, because they expect a followthrough in the next trading session. Figure 4 shows the number of times the index closed in the top or bottom 10% of the daily range, then moved up or down the following day. The tests were run over the 100 days prior to the test date.
Figure 4: Nasdaq Top & Bottom of Range Closings. As an example, the test run for the 100 days prior to February 4, 2004, shows that of the 25 times the Nasdaq Composite closed in the top 10% of its daily range, 10 times it was up the following day and 24 times it closed down the following day (once it was unchanged). During the 400 trading days tested, the Nasdaq closed down the next day after a top 10% closing about 57% of the time. Some short-term traders believe that certain days of the week are better for trading than others. I also tested this idea and did not find a significant advantage, as shown in Figure 5. Here, you see the percentage of times the Nasdaq composite is up on a given day of the week during the test period. Each test period covers the 100 trading days prior to the test date. During the 400 days tested, it appears that Monday and Friday have a smaller variance than the other days of the week, but there is nothing that would cause me to focus on the day of the week rather than the other items I've mentioned.
Figure 5: Percentage of Time Nasdaq is up on a given day.
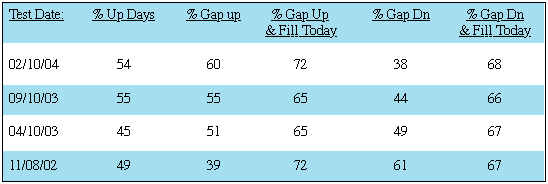
Many discussions on short-term trading eventually come around to how to deal with gaps. Figure 6 provides information on Nasdaq gaps. A gap up occurs when today's open is greater than yesterday's close. A gap down occurs when today's open is below yesterday's close. The testing was done for the 100 trading days prior to the test date. Percent up days is the percentage of time the Nasdaq closed up during the test period. Percentage gap up is the percentage of time the Nasdaq gapped up at the open. Percent gap up & fill today is the percentage of time during the test period that the Nasdaq gapped up, then filled the gap at some time during the rest of that day's trading session.
Figure 6: Nasdaq gap data.
Note that gaps are not only common, but they happen most of the time. The useful knowledge that short-term traders take away from Figure 5 is that gaps are filled two-thirds of the time. This may be where the often-heard advice not to trade in the first half hour comes from. Since the market gaps most of the time and fills the gap two-thirds of the time, the short-term trader may get a better entry by waiting for the market to fill the day's gap, and then take an entry instead of taking the entry if it triggers on the opening gap. Short-term trading is typically harder that trading longer-term techniques, but should be part of the trader's toolbox. It is important to master several different trading styles, and let the current market conditions tell you which one to use. It's not only important to take trades in the direction of the market, but to use the market environment to adjust the style of trading used.
Steve Palmquist may be reached at letter@daisydogger.com. His website is www.daisydogger.com.
Suggested readingBulkowski, Thomas [2000]. Encyclopedia Of Chart Patterns, John Wiley & Sons.Palmquist, Steve [2004]. "Trading Market Conditions," Working-Money.com: May 21. Current and past articles from Working Money, The Investors' Magazine, can be found at Working-Money.com. |
| Website: | www.daisydogger.com |
PRINT THIS ARTICLE

Request Information From Our Sponsors
- StockCharts.com, Inc.
- Candle Patterns
- Candlestick Charting Explained
- Intermarket Technical Analysis
- John Murphy on Chart Analysis
- John Murphy's Chart Pattern Recognition
- John Murphy's Market Message
- MurphyExplainsMarketAnalysis-Intermarket Analysis
- MurphyExplainsMarketAnalysis-Visual Analysis
- StockCharts.com
- Technical Analysis of the Financial Markets
- The Visual Investor
- VectorVest, Inc.
- Executive Premier Workshop
- One-Day Options Course
- OptionsPro
- Retirement Income Workshop
- Sure-Fire Trading Systems (VectorVest, Inc.)
- Trading as a Business Workshop
- VectorVest 7 EOD
- VectorVest 7 RealTime/IntraDay
- VectorVest AutoTester
- VectorVest Educational Services
- VectorVest OnLine
- VectorVest Options Analyzer
- VectorVest ProGraphics v6.0
- VectorVest ProTrader 7
- VectorVest RealTime Derby Tool
- VectorVest Simulator
- VectorVest Variator
- VectorVest Watchdog

