HOT TOPICS LIST
- Strategies
- Stocks
- Buy
- Investing
- Brokers
- Psychology
- Interviews
- Accumulate
- Sell
- Hold
- Spotlight
- Websites
- Candlestick Corner
- Gold & Metals
- Options Trading
LIST OF TOPICS
THE OPTIMIZED TRADER
Waiting For Breakouts
08/25/04 03:54:44 PM PSTby David Penn
Good, old-fashioned breakouts from consolidations may be the technician's equivalent of a waist-high fastball. But traders who wait for the hanging change-up might find themselves with an even better pitch to hit.
| Is there anything more triumphant for the technical analyst or technically oriented trader than capturing a big fat breakout from a trading range? Some of the best, most fundamental books on technical analysis -- those recommended to aspiring technicians to this day -- underscore the role of consolidations and "bases" in initiating significant price moves. Consider, for example, this point from William O'Neil, from his book How To Make Money In Stocks:
Chart patterns are simply areas of price correction and consolidation, usually after an earlier price advance. The primary challenge in analyzing price consolidation structures is to diagnose if the price and volume movements are normal or, instead, signal significant weakness or distribution. It's true that "faulty base structures," not unlike "completely obvious patterns," are often more apparent after the fact than before it. But O'Neil's basic premise — echoed by scores of technical analysts before and since — remains intact: In order for a stock to blast off, it needs a decent launching pad. Buying breakouts is a particularly popular strategy when prices are rallying strongly, with sharp, short corrections and pullbacks (or, better yet, flat, sideways consolidations). As such, breakouts were a big topic in the last stages of the secular bull market that ended in 2000 — as well as during the cyclical bull market from October 2002 until the spring of 2004. Spotting breakouts from consolidations couldn't be simpler, and it works on all time frames. Look for extended, horizontal consolidations. These consolidations indicate a shrinking range in prices and decreasing volatility. While shrinking ranges often lead only to even tighter ranges, and decreasing volatility often leads to more of the same, it is also true that explosive moves in stocks arise out of tight price ranges and volatility that has gotten "too low" based on historical trends. What is tricky is determining how and when to enter a position in a stock that is breaking out. Often, part of the good news about breakouts is the bad news: Spotting them tells you, among other things, that the stock has already made an impressive move. While impressive moves are sometimes followed immediately by further impressive moves, it is also true that stocks tend to pull back, or reconsolidate, for at least some period of time after the breakout. As such, swing trading breakouts might make more sense to many traders than pouncing upon them. By swing trading breakouts, I mean using breakouts as a signal that the market is ready to move, but not necessarily viewing them as an entry signal. After the breakout, find a spot — perhaps midway through the breakout — that represents the level at which the stock appears attractive on price. If and when the stock pulls back to that level, a trader can enter a position with the relative support of the previous consolidation range. Why this approach? Is it because, as Oliver Velez of Pristine.com once noted, "Only amateurs buy new highs"? Velez's point was that it is often the habit of professional traders to fade breakouts by selling new highs with a tight stop. While nonprofessional swing traders won't look to fade breakouts, they can try to take advantage of the professionals' behavior. By buying the post-breakout dip — a dip created both by profit-taking at the new highs, as well as short-selling by pros fading those new highs — swing traders are able to buy a market that has already proven its ability to move higher while it is still cheap (at least, cheap relative to the breakout close).
Swinging breakoutsPart of my thinking behind a swing approach to trading breakouts comes from several essays on swing trading by Linda Bradford Raschke, Market Wizard and principal of the LBR Group (www.lbrgroup.com). Writing in a piece called "Swing Trading: Rules And Philosophy," Raschke notes that swing traders should:
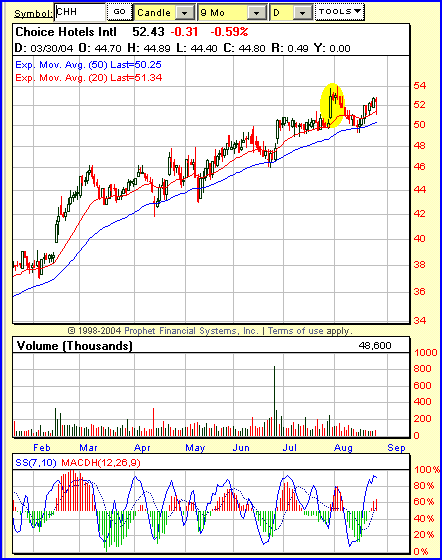
Start searching for a buying day two days after a swing high or, conversely, a shorting day two days after a swing low. Ideally, the market will move in complete five-day cycles. In a strong trend, the market will move four days in the primary direction and only one in reaction. Thus, one must seek entry one day earlier. Raschke is, to a degree, a pupil of George Taylor, whose Taylor Trading Technique is an essential text on the strategy of swing trading (first published in 1950). But Raschke's basic point about using fresh highs and lows as signals to begin planning an entry is key both to swing traders and, perhaps, to breakout/momentum traders looking to maximize their entries and exits. Consider the chart of Choice Hotels International (Figure 1). CHH broke out on strong (if not completely overwhelming) volume on July 29 after moving up in a well-defined uptrend. The stock had spent virtually the entire month of July in a trading range and, just as the month drew to a close, CHH broke out in a stunning $3 day. If that wasn't a breakout, then I don't know what is.
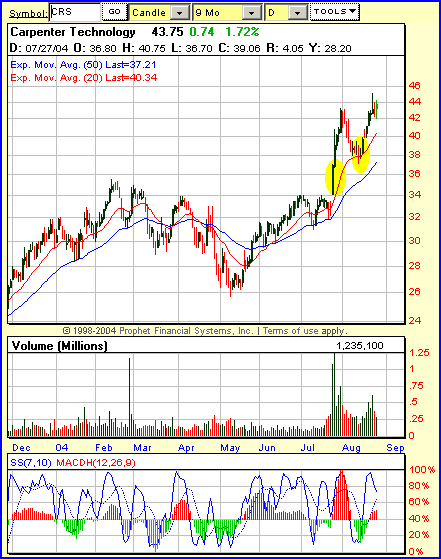
The problem, however, came for anyone who chased the stock, buying it near $53 at the close. For as CHH pulled back from its intraday highs on the breakout day, the stock continued to drift lower and lower in the following days, finally finding support at the 50-day exponential moving average. What's interesting is that many traders who were trying to buy the breakout would have probably exited the trade at $50. After all, CHH made an intraday high of $54 and then proceeded to move lower for the next six consecutive days — actually, CHH was down eight out of nine days following that doji-like intraday tick at $54. Few traders would have stuck around for almost two trading weeks, waiting for what should have been a relatively quick point or two to the upside. This is not to say that some breakouts can't be jumped on lock, stock, and barrel from the swing or short-term momentum perspective. The chart of Carpenter Technology (Figure 2) shows a breakout that was perfectly buyable even at the highs of the breakout day. Breaking out from a three-week consolidation in late July, shares of CRS shot up from near $34 to near $37 on the breakout day, and continued to move higher for four more consecutive days with a closing high of about $43. That's six-odd points in four days.
Figure 2: Some breakouts move far enough way from the "gravitational pull" of their bases to make their inevitable pullbacks a relatively minor affair. Nevertheless, the CRS shares that a breakout trader purchased at $37.50 were the same ones a swing trader purchased at the same price days later, but with much less risk.
But not every stock will perform as consistently, post-breakout, as Carpenter Technology. Especially in bear markets — or in markets caught between bull and bear — breakouts can be particularly prone to failure. This is why, whether or not a trader prefers to jump on breakouts as soon as they occur, learning how to play the potential post-breakout scenario can be a key ingredient in an overall short-term or swing-trading strategy.
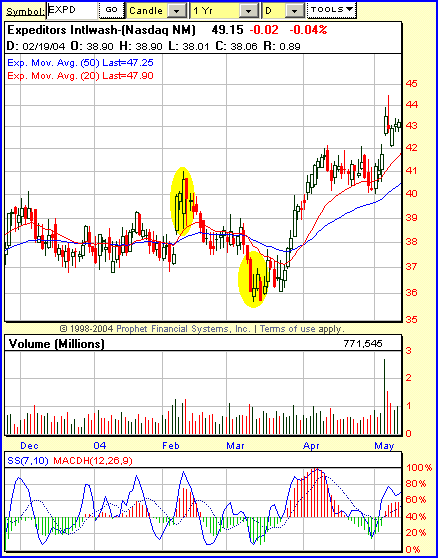
The Post-breakout BounceConsider the chart of Expeditors International (Figure 3) in the first months of 2004. The stock had been trading in a range between $37 and $40 — actually, this range often tightened to a narrow $37 to $39 spread during December and January. However, in February 2004, shares of EXPD gapped up sharply on strong volume (volume was at a two-month high), testing the top of that two-month range. Over the next two days, the stock did not move significantly higher (EXPD tested $41 on an intraday basis), but it did appear to hold its breakout.
Figure 3: Shares of EXPD in the first few months of 2004 provided more than one range-breaking move. But the rewards would come to the trader patient enough to avoid EXPD in early February, and pounce in mid- to late March.
Time to buy? And that's assuming you didn't jump in on the big-volume breakout already. Unfortunately for traders who chased the breakout, EXPD reversed toward the middle of February and plunged back into the trading range. What's worse, the stock then went on to fall beneath the range, trading under $36 by mid-March. A 10% loss, four points, might not be much of a hit for investors with longer time frames. But for those short-term and swing traders who are willing to lose no more than 75 cents, four-point declines just aren't tolerable. So what's a Swift Chart Trader to do? By waiting to see how the stock traded in the immediate post-breakout environment, a swing or otherwise short-term trader could have, for example, bought EXPD in late February with a tight stop (say, near $37), essentially daring the stock to "do that again." If the bulls are gaining control of the stock, then that is exactly what the stock will do: move higher. The only difference is that, in this instance, the trader doesn't have to suffer the agony of seeing a position in a $40 stock become a position in a $36 stock and then become a $40 stock again. A trader might have even spotted the positive divergence between the consecutively lower price troughs in late February and mid-March and the consecutively higher stochastic troughs. This development could have been a signal to initiate a long position (again with a snug stop), to add to a long position (for the trader who followed the strategy in the previous paragraph), or merely as a confirmation that the early February breakout was in fact a true indication of the control the buyers had over EXPD. In any event, EXPD ended March at about $40 and by the end of May was trading near $46. I began this discussion by praising breakouts. And I don't want any of the suggestions offered subsequently to detract from that endorsement. Breakouts on strong volume mean one thing: a lot of people want to buy, and buy now. It makes no sense, really, to blindly fade that kind of obvious intent on the part of the market. But remember that not every breakout will lead to higher prices immediately, or without — as markets are wont to do — causing as much discomfort and pain as possible to all involved. Still, for those traders who feel paralyzed with indecision when the temptation of a big-volume breakout comes flying over the plate, waiting to play the post-breakout bounce can be another way of making contact.
David Penn may be reached at DPenn@Traders.com.
Suggested readingO'Neil, William [1988]. How To Make Money In Stocks, McGraw-Hill.Raschke, Linda Bradford [2003]. "Swing Trading: Rules And Philosophy," LBR Group at www.lbrgroup.com. Taylor, George D. [1994]. The Taylor Trading Technique, Traders Press. Velez, Oliver, and Greg Capra [2000]. Tools And Tactics For The Master DayTrader, McGraw-Hill.
Charts courtesy Prophet Financial Systems
Current and past articles from Working Money, The Investors' Magazine, can be found at Working-Money.com. |
Technical Writer for Technical Analysis of STOCKS & COMMODITIES magazine, Working-Money.com, and Traders.com Advantage.
| Title: | Traders.com Technical Writer |
| Company: | Technical Analysis, Inc. |
| Address: | 4757 California Avenue SW |
| Seattle, WA 98116 | |
| Phone # for sales: | 206 938 0570 |
| Fax: | 206 938 1307 |
| Website: | www.traders.com |
| E-mail address: | DPenn@traders.com |
Traders' Resource Links | |
| Charting the Stock Market: The Wyckoff Method -- Books | |
| Working-Money.com -- Online Trading Services | |
| Traders.com Advantage -- Online Trading Services | |
| Technical Analysis of Stocks & Commodities -- Publications and Newsletters | |
| Working Money, at Working-Money.com -- Publications and Newsletters | |
| Traders.com Advantage -- Publications and Newsletters | |
| Professional Traders Starter Kit -- Software | |
PRINT THIS ARTICLE

Request Information From Our Sponsors
- VectorVest, Inc.
- Executive Premier Workshop
- One-Day Options Course
- OptionsPro
- Retirement Income Workshop
- Sure-Fire Trading Systems (VectorVest, Inc.)
- Trading as a Business Workshop
- VectorVest 7 EOD
- VectorVest 7 RealTime/IntraDay
- VectorVest AutoTester
- VectorVest Educational Services
- VectorVest OnLine
- VectorVest Options Analyzer
- VectorVest ProGraphics v6.0
- VectorVest ProTrader 7
- VectorVest RealTime Derby Tool
- VectorVest Simulator
- VectorVest Variator
- VectorVest Watchdog
- StockCharts.com, Inc.
- Candle Patterns
- Candlestick Charting Explained
- Intermarket Technical Analysis
- John Murphy on Chart Analysis
- John Murphy's Chart Pattern Recognition
- John Murphy's Market Message
- MurphyExplainsMarketAnalysis-Intermarket Analysis
- MurphyExplainsMarketAnalysis-Visual Analysis
- StockCharts.com
- Technical Analysis of the Financial Markets
- The Visual Investor


