HOT TOPICS LIST
- Strategies
- Stocks
- Buy
- Investing
- Brokers
- Psychology
- Interviews
- Accumulate
- Sell
- Hold
- Spotlight
- Websites
- Candlestick Corner
- Gold & Metals
- Options Trading
LIST OF TOPICS
THE CHARTIST
Corrective Rising Wedges
08/25/04 03:51:43 PM PSTby Arthur Hill
Here's pattern analysis at work.
| Typically, the rising wedge is a bearish pattern that can foreshadow a significant decline. However, there are two kinds of wedges, and picking the right wedge at the right time can increase the odds of success. This is a simple case of trading in the direction of the larger trend. A properly identified rising wedge can act as a powerful signal, whether it points to a reversal or a continuation pattern.
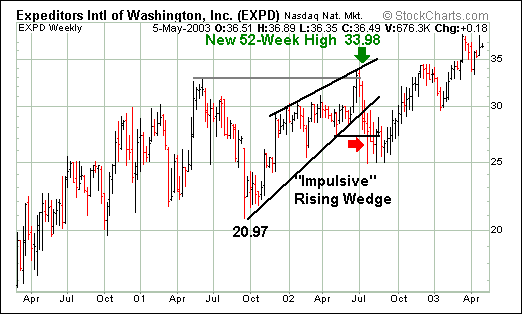
Identifying the larger trendThere is a certain ebb and flow to price movements. The larger trend consists of price movements in the direction of the trend, with smaller-scale price movements that run counter to the trend from time to time. In Elliott wave terms, a movement in the direction of the trend would be impulsive and a movement running counter to the trend would be corrective. The corrective move runs counter to the larger trend, and represents a price move that is smaller than the prior or impulsive move. In an uptrend, the smaller corrective move would be a decline. In a large downtrend, the smaller corrective move would be an advance. The rising wedge marks an advance, but it is important to qualify this advance as corrective or impulsive. A security that is recording new highs is in a clear uptrend, and any advance would be deemed impulsive or in harmony with the larger uptrend. Rising wedges within a larger uptrend have the trend on their side and should be treated as impulsive rising wedges. Bearish reversals or declines, while certainly possible, would be fighting the larger uptrend, and this increases the odds of a bullish resolution. Conversely, rising wedges within a larger downtrend should be treated as corrective rising wedges. Bearish reversals or declines would signal a continuation of the prior decline (or larger downtrend) and be deemed impulsive. With the advance from 20.97 to 33.98, Expeditors International (Figure 1) formed a clear rising wedge. The stock even broke trendline support and declined below its prior low (red arrow), which seemed to confirm the pattern as bearish. However, the stock also forged a new 52-week high at 33.98, which made the larger trend bullish and the pattern an impulsive rising wedge. Even though the stock appeared to break down, the larger (up)trend trumped the smaller decline and carried the day with a move to new highs in 2003.
Figure 1: Identifying the larger trend
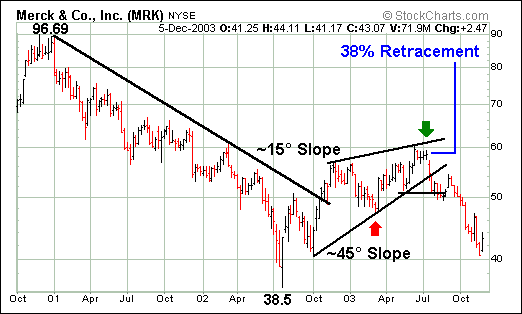
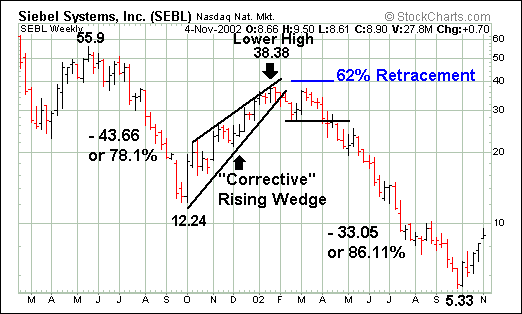
Typical retracementCorrective rising wedges follow a substantial decline and then retrace a portion of that decline. This ensures that a subsequent trend reversal and decline will be in harmony with the larger trend or the previous decline. A corrective rising wedge should peak below the peak of the prior decline. A move above that peak would forge a higher high and turn the corrective move into an impulse move. Typically, a corrective rising wedge retraces between 38% and 62% of the prior decline. Because technical analysis is a little bit of art and a little bit of science, these levels are not etched in stone. Securities can undershoot (peak below the 38% retracement mark) or overshoot (peak above the 62% retracement mark). As long as the overshoot remains comfortably below the prior peak, the advance and the wedge can still be classified as corrective. The 3862% retracement zone is simply there to alert traders of a potential reversal area or peak. Note that 38% and 62% stem from the Fibonacci numbers 38.2 and 61.8, respectively. Figures 2 and 3 (Merck and Siebel) show Merck declining from 96.69 to 38.5 and the rising wedge retracing just over 38% of that decline. Siebel, which is a more volatile stock, declined from 55.9 to 12.24, and the rising wedge retraced 62% of that decline. As Siebel illustrates, the more volatile the stock, the more likely the retracement will reach the upper target (62%) o even overshoot.
Figure 2: A typical retracement
Figure 3: Higher volatility. A more volatile stock usually retraces more of the prior decline.
Trendline relationshipA rising wedge is characterized by two trendlines of different slopes. The lower trendline rises at a steeper slope than the upper trendline, and the two trendlines converge as prices extend. The shallow slope of the upper trendline shows that buyers are not keeping up the pace, as the higher highs are not matching the pace of the higher lows. Even though a higher high has been recorded, the shallower slope of the upper trendline reflects diminishing buying pressure at higher levels. As the chart for Merck (MRK) in Figure 2 shows, the lower trendline slopes up at approximately 45 degrees, while the upper trendline slopes up at approximately 15 degrees. (It is not necessary to measure the slope of the trendlines; a simple visual inspection is usually enough.) The point is that the higher high (green arrow) is not keeping pace with the higher low (red arrow).
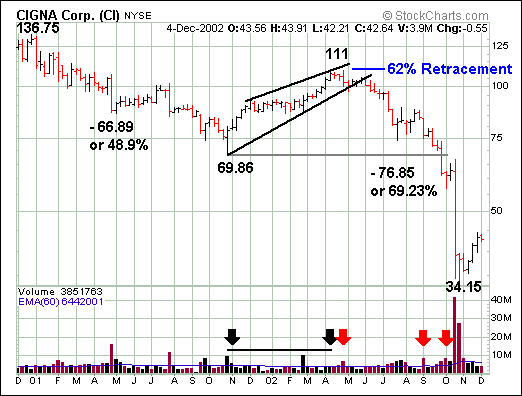
VolumeAlthough it's not a prerequisite, it is preferable to see low volume as the wedge evolves. Low volume is characteristic of bearish consolidations such as rising wedges and rising flags. Rising wedges are typically longer in duration than flags, which tend to be short-term continuation patterns or bearish consolidations. Despite the differences in time frame, the patterns share many similarities, and their robustness increases when volume is low. Low volume reflects a lack of conviction in the advance and increases the chances of a successful bearish reversal. As Figure 4 (Cigna) shows, the advance from 69.89 to 111 occurred on relatively low volume. Except for early November 2001 and early March 2002, volume during the advance was largely below average (60-week EMA). There was not much fuel in this advance, and the evolution of a rising wedge suggests a bearish consolidation in the works. In addition, note that volume began to expand as the stock broke below the lower trendline and declined from April 2002 to October 2002 (red arrows).
Figure 4: Wedges and volume. During the formation of a wedge, you would rather see low volume.
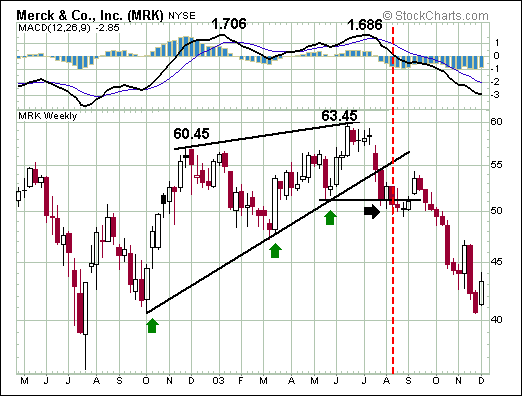
ConfirmationA rising wedge can be confirmed in two steps: a trendline break and a lower low. In addition, traders can turn to key momentum indicators to confirm a trend change. A move below the lower trendline signals that buying pressure is faltering. The reduced slope of the upper trendline (higher highs) shows that buyers are not able to push prices in line with the lower trendline (higher lows). However, buyers still have a slight edge as long as the lower trendline holds. After all, the lower trendline is slanting up, and prices carry an upward bias as long as this line holds. Once this trendline is broken, the upward bias is clearly not as strong as before, and the next test is the prior low. After a trendline break, traders should identify the key reaction low to confirm a trend change. A series of higher lows forms as a security works its way higher within a rising wedge. As long as the higher lows persist, sellers have yet to wrestle control from buyers. A decline below the prior low shows an actual increase in selling pressure, and this confirms the rising wedge as bearish. Sellers are now in control, and this signals a continuation of the prior decline. MACD (moving average convergence/divergence) and other momentum indicators can be used to confirm a trend change and continuation lower. Because the rising wedge forms higher highs as it evolves, traders can look for a bearish divergence in key indicators to anticipate a reversal. For example, a MACD signal line crossover or move into negative territory can be used to confirm a trendline break or even a lower low. After bottoming in July 2002, Merck (Figure 5) formed a series of higher lows (green arrows) to form the lower trendline of the rising wedge. The trendline break showed that the advance was faltering, as buyers were not able to keep prices above the rising trendline. The subsequent break below the prior low affirmed this weakness and showed increased selling pressure for the first time in months. Further, MACD formed a bearish divergence as the stock moved to a new reaction high of 63.45 and MACD failed to follow suit by forming a lower high at 1.686. The bearish divergence was confirmed with a signal line crossover and a move into negative territory as the stock broke below the lower trendline and prior low (dotted red line).
Figure 5: Confirmation. Here a bearish divergence was confirmed by the MACD signal line crossover and a move into negative territory. Price projectionsOnce confirmed, the beginning of the formation becomes the minimum downside target. The reaction lows within the rising wedge will act as support on the way down, but traders should not count on these levels to hold. After a security zigzags higher (as in the rising wedge), it usually declines at a faster rate, and another zigzag is unlikely. The lowest point of the formation represents the last bastion of support before a significant low. Once this is broken, the security is usually trading at multimonth lows and the bears are clearly in control. A second, and usually lower, downside target can be estimated with a measured move. The measured move is often associated with pennants and flags. However, like these two patterns, the rising wedge is also a bearish consolidation, and traders can apply the measured move criteria for a target that implies a second decline equal to the first decline. To find the target, subtract the length of the first decline from the rising wedge peak. This is usually done with absolute numbers, but sometimes it is necessary to use percentages. In Figure 3 the first decline was 43.66 points, or 78.1%. The peak of the rising wedge is at 38.38, and a 43.66-point decline is impossible, as stocks cannot go below zero. Therefore, the measured move target should be calculated based on percentages. The target was 8.44, and the stock overshot this with a decline below 6. In Figure 4, the first decline was 66.89 or 48.9% and the stock peaked at 111. The absolute target was 44.11, and the percentage-based target was 56.72. The stock obviously overshot both targets, which can be attributed to the virtual freefall in October.
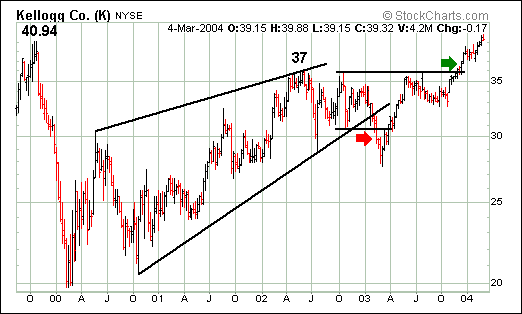
FailuresAll patterns experience failures, and traders should prepare accordingly. The first sign of failure is when a support break fails to hold. This can be the trendline break or the break below the prior low. Should a security move back above these levels, the chances of success are diminished. A recovery and subsequent resistance break would clearly nullify the pattern and put the bulls back in control. In Figure 6 (Kellogg), prices formed a large rising wedge that exceeded the normal retracement zone (38-62%). However, the pattern looked robust and the stock formed a reaction high below 40.94. Kellogg broke the lower trendline and prior low at 31.28 (November 2002) to confirm the rising wedge (red arrow), but the stock quickly recovered with a move back above these breaks. The sharpness and speed of the recovery signaled that something was not quite right with this wedge. The resistance break around 36 fully negated the wedge, putting the stock back in bull mode (green arrow).
Figure 6: Pattern failure. Even though it appeared as though the downward trend would continue after the rising wedge formed, prices moved back up above all the breaks and continued moving up.
Rising wedgesTechnical analysis methods are applicable across different time frames. The examples provided in this article use weekly charts and cover relatively long time frames. However, rising wedges can be found on intraday, daily, and even monthly charts. What's more, the same analysis techniques can be applied to validate the patterns, confirm breakdowns, and make projections. When qualified as a correction within a larger downtrend, the rising wedge can foreshadow a significant decline. The rising wedge signals a reversal by marking the end of the corrective advance, and a continuation by signaling a resumption of the prior decline. Taken together, these are powerful signals that traders can use and capitalize on with short positions, by avoiding such securities completely. Although not all signals result in significant declines, the downside projections are quite substantial and the risk-to-reward ratio is good enough to absorb a few losses.
Arthur Hill is editor and publisher of www.tdtrader.com, a website specializing in trading strategies, sector/industry specific breadth stats, and overall technical analysis. He can be reached at arthuh@tdtrader.com.
Suggested readingBulkowski, Thomas [2000]. Encyclopedia Of Chart Patterns, John Wiley & Sons.Edwards, Robert D., and John Magee [2001]. Technical Analysis Of Stock Trends, 8th ed., WHC Bassetti, ed. Saint Lucie Press. Murphy, John J. [1986]. Technical Analysis Of The Futures Markets, New York Institute of Finance. Charts courtesy StockCharts.com
Current and past articles from Working Money, The Investors' Magazine, can be found at Working-Money.com.
|
Arthur Hill is currently editor and publisher of TDTrader.com, a website specializing in trading strategies, sector/industry specific breadth stats and overall technical analysis. He is a full member of the Society of Technical Analysts (STA London) and teaches the Momentum module for the STA diploma exam. Prior to TD Trader, Arthur worked for Stockcharts.com and wrote much of the site's education center.
| Title: | Editor/Publisher |
| Company: | TDTrader.com |
| Website: | www.tdtrader.com |
| E-mail address: | arthurh@tdtrader.com |
Traders' Resource Links | |
PRINT THIS ARTICLE

Request Information From Our Sponsors
- StockCharts.com, Inc.
- Candle Patterns
- Candlestick Charting Explained
- Intermarket Technical Analysis
- John Murphy on Chart Analysis
- John Murphy's Chart Pattern Recognition
- John Murphy's Market Message
- MurphyExplainsMarketAnalysis-Intermarket Analysis
- MurphyExplainsMarketAnalysis-Visual Analysis
- StockCharts.com
- Technical Analysis of the Financial Markets
- The Visual Investor
- VectorVest, Inc.
- Executive Premier Workshop
- One-Day Options Course
- OptionsPro
- Retirement Income Workshop
- Sure-Fire Trading Systems (VectorVest, Inc.)
- Trading as a Business Workshop
- VectorVest 7 EOD
- VectorVest 7 RealTime/IntraDay
- VectorVest AutoTester
- VectorVest Educational Services
- VectorVest OnLine
- VectorVest Options Analyzer
- VectorVest ProGraphics v6.0
- VectorVest ProTrader 7
- VectorVest RealTime Derby Tool
- VectorVest Simulator
- VectorVest Variator
- VectorVest Watchdog

