HOT TOPICS LIST
- Strategies
- Stocks
- Buy
- Investing
- Brokers
- Psychology
- Interviews
- Accumulate
- Sell
- Hold
- Spotlight
- Websites
- Candlestick Corner
- Gold & Metals
- Options Trading
LIST OF TOPICS
DOW THEORY
The Dow Days Of Summer
09/01/04 04:07:23 PM PSTby David Penn
Back together again, the Dow industrials and Dow transports take out their July 2004 lows on the same day. But if that's so bearish, then what's up with the bounce?
| Sometimes, technical analysts using Dow theory give the erroneous impression that confirmation -- what Robert Edwards and John Magee, in their classic Technical Analysis Of Stock Trends, describe as the principle by which "no valid signal of a change in trend can be produced by the action of one average alone" — is always a rousing crescendo of an event, and that followthrough in the direction of the confirmation is both immediate and assured. Not only can this lead some technicians to assume that confirming moves between the Dow industrials and Dow transports always happen simultaneously (or virtually so), but it also encourages some to believe that as soon as a Dow signal is provided, immediate action (buying the market on a Dow buy signal or selling the market on a Dow sell signal) is preferable to cautious action. After all, if you believe that Dow theory works and that a directional signal has been provided by the action of the averages, what's the point of waiting? Why not load up the truck, yank out the backseat, pack your pockets — whatever metaphor you want to use for "assuming a position" — and just do it? The answer may be that Dow theory's directional signals are more accommodating of swing and position traders (to say nothing of longer-term investors) than some quick-triggered traders might prefer. In looking at Dow theory's first major sell signal in March 2004, and the bearish confirmation that came in early August, it increasingly appears that Dow theory's directional signals suggest not so much "Go, baby, go!" as "People, get ready."
Confirmation catechismWhile I have suggested that confirmations are not always simultaneous events (that is, a move in the industrials may be confirmed by the transports, but perhaps not for a brief period), it is still true that same-day confirmations between the averages are not at all rare. In a previous discussion of Dow theory, I noted how there were a number of key same-day confirmations between the industrials and transports during the markets' advance in the autumn of 2003 (see my Traders.com Advantage article, "Dow 3,000," December 4, 2003).
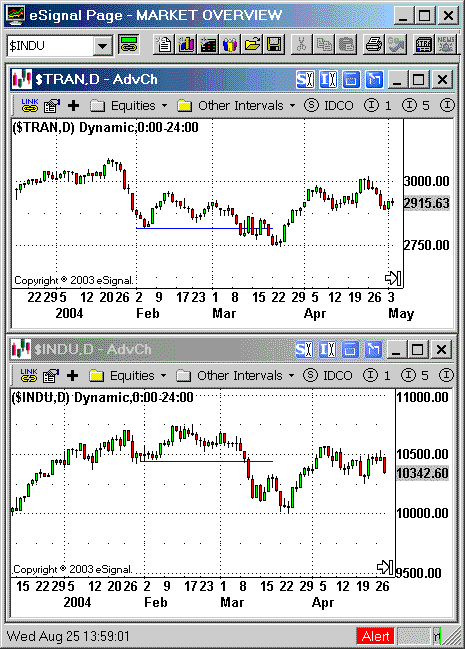
Figure 1: The bearish confirmation in March was the best signal that the bull market that began in the spring of 2003 might be coming to an end. Both the industrials and the transports took out the previous month's lows on the same date in March.
For those who follow Dow theory confirmations, it didn't get much better than the action in the averages toward the end of 2003. Going into 2004, however, the relationship between the averages was characterized largely by "nonconfirmations." Nonconfirmations occur when the averages refuse to confirm each other and are, at the end of the day, Dow theory "nonevents." To quote Edwards and Magee, "They have (so far) refused to confirm the Industrials and, hence, the Major trend of the market must be regarded as still Down" (italics original). (See Figure 1.) However, to say that nonconfirmations are Dow theory nonevents is not the same thing as saying that they are technical nonevents. In other words, although Dow theory insists that only confirmation matters where trend reversals and continuations are concerned, those aware of the broader world of technical analysis may still derive information from a divergence between the Dow industrials and Dow transports. This is a good thing, too, because there were plenty of nonconfirmations in the first few months of 2004 to go around.
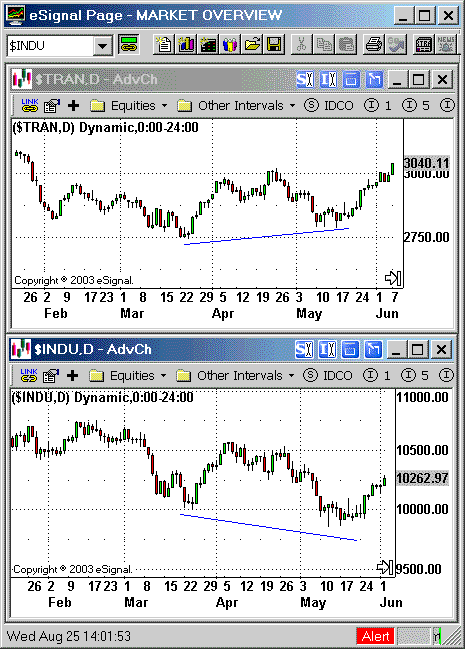
Revenge of the non-consThe first Dow theory confirmation of 2004 was a bearish one: the March breaking of the February lows by both the Dow industrials and Dow transports. But note what happened shortly after those bearish confirmations. Within 10 days, both the industrials and the transports were rocketing away from their bearish downside move. The 10th day after the confirmation was especially strong in both averages and, soon afterward, both averages were zooming toward tests of their March and (in the case of the transports) February 2004 highs. Something very similar took place later in the year — in August, to be specific. In the days, weeks, and months since the March bearish confirmation, the averages had gotten back out of gear with each other. This was most obvious in the May 2004 nonconfirmation that likely panicked many bearish Dow theorists into fearing that the correction that began in 2004 might be over. This nonconfirmation consisted of a Dow industrials that used its May correction as an opportunity to take out the March lows, and a Dow transports that had a May correction that remained clearly above (to say nothing of "taking out") its March lows. See Figure 2.
Figure 2: A Dow theory nonevent, the nonconfirmation in May was nonetheless a strong signal for bears to take any gains.
To repeat, Dow theory stipulates that in the event of a nonconfirmation, the prevailing trend must be considered intact. That is fine enough as far as it goes, but aggressively bearish investors and traders would have spent the month following that nonconfirmation stewing in discontent and losses as both averages moved higher in late May and soared into June (this was especially the case with the Dow transports). The rally in the transports early in the summer of 2004 was a surprise to most observers. It is interesting to note that in June, as the transports were breaking out, crude oil futures were breaking down in a correction that would eventually launch crude oil on its run toward $50 a barrel. In any event, the transports went on to set a new yearly high in mid- to late June, a truly startling event in light of the failure of the industrials to advance beyond even the March 2004 highs during their June rally. This, however, set up another nonconfirmation — this time, one to the upside. We now know two things about such events. The first is that, in spite of the nonconfirmation, Dow theory catechism tells us that the prevailing trend — which, since the March bearish confirmation, was downward — is still intact. The second thing we know is that while nonconfirmations are Dow theory nonevents, the last nonconfirmation to the downside resulted in a significant rally (a spectacular rally in the transports). Would it be so foolish to consider whether a nonconfirmation to the upside might not result in a similar, but opposite effect — that is, a significant decline (and perhaps a spectacular decline in the transports)?
The confirmation reactionIn the wake of the June nonconfirmation to the upside in the Dow industrials and transports, the averages have corrected 6.5% and 7.5%, respectively. While it is reasonable to credit nonconfirmations as signals given this kind of evidence, it is worth remembering that this nonconfirmation also supported the greater trend (as indicated by the March bearish confirmation). In other words, selling an upside nonconfirmation in the wake of a Dow theory sell signal is like selling a rally in a downtrend. This is not meant to take anything away from the rally that resulted from the nonconfirmation to the downside back in May (6.5% for the industrials, 14% for the transports). But those Dow theory purists who nonetheless want to take advantage of secondary reactions (that is, intermediate-term moves against the primary trend) may find greater comfort in incorporating nonconfirmations when the reversals they portend are pro-trend.
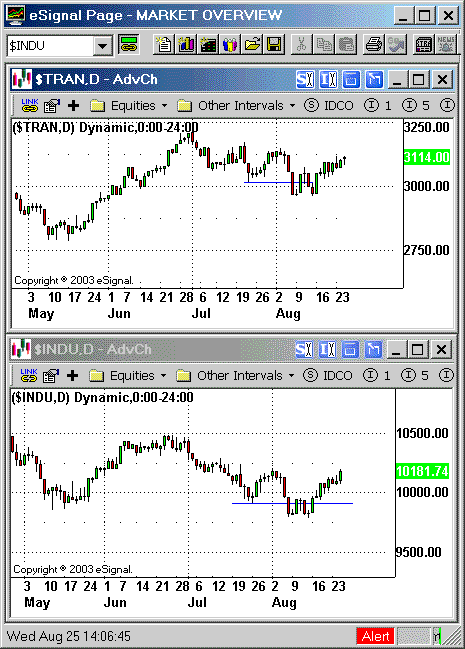
Figure 3: A few days after the same-day bearish confirmation in August, a "confirmation reaction" sends both the industrials and transports on a ride higher.
Another potential advantage comes from a sort of "confirmation reaction" effect (Figure 3). Do you remember how the markets made bearish confirmations in March 2004? Within 10 days, any short position taken in pursuit of those bearish gains would have been underwater — and getting deeper by the day. Now consider what happened as the Dow averages fell from their June nonconfirmation. By early August, the Dow industrials took out not only their June lows, but their July and May lows as well. In fact, a new year-to-date low was set by the industrials during this decline. At the same time, the Dow transports took out the June and July lows, but failed to move beyond the May lows. So we have a confirmed move below the July lows, but the failure of the transports to move below the May lows (so that both averages would be setting new year-to-date dips) provides room for caution for those looking to jump on the short side once again. True to "confirmation reaction" form (and true to the last nonconfirmation to the downside in May), the averages rallied sharply afterward. Within five days, both averages were again showing strength, and six days after the July lows were taken out in both averages, the rally qua bounce was clear. The move toward resistance at (and in the case of the transports, above) their intermediate-term, 50-day exponential moving averages was on. What caught my eye was the way the averages reacted shortly after the bearish confirmations. Rather than providing immediate followthrough, the averages in both instances backed off before eventually moving back down to lower lows. This suggests to me that it is probably preferable to use the post-confirmation reaction as an opportunity to explore positions that will be most profitable once the market's "confirmation reaction" is complete. For example, in the wake of the bearish confirmation, a trader could begin looking for stocks that are topping out (as the market is rising in a bear market rally), and an investor could begin selling into that post-confirmation reaction strength. A similar sort of reconnaissance work could have been done with regard to the reaction to the bearish confirmation in August (the simultaneous violation of the July lows).
Red light, green lightI've been impressed by the notion that there are market signals that can be used less as triggers and more as leading indicators of price behavior. Whether it is in monitoring extreme MACD (moving average convergence/divergence) histogram values to detect changes in trends, using breakouts as a way of spotting pullbacks in markets that have indicated higher, or observing the confirmation reaction that can take place when using Dow theory to monitor market action, often what we see as a "sign in the sky" is less an announcement of what to do now and perhaps more a hint of what to do next.
David Penn may be reached at DPenn@Traders.com.
Suggested readingEdwards, Robert D., and John Magee [2001]. Technical Analysis Of Stock Trends, 8th ed., WHC Bassetti, ed. Saint Lucie Press.Penn, David [2003]. "Dow 3,000," Traders.com Advantage: December 4. Charts courtesy eSignal
Current and past articles from Working Money, The Investors' Magazine, can be found at Working-Money.com. |
Technical Writer for Technical Analysis of STOCKS & COMMODITIES magazine, Working-Money.com, and Traders.com Advantage.
| Title: | Traders.com Technical Writer |
| Company: | Technical Analysis, Inc. |
| Address: | 4757 California Avenue SW |
| Seattle, WA 98116 | |
| Phone # for sales: | 206 938 0570 |
| Fax: | 206 938 1307 |
| Website: | www.traders.com |
| E-mail address: | DPenn@traders.com |
Traders' Resource Links | |
| Charting the Stock Market: The Wyckoff Method -- Books | |
| Working-Money.com -- Online Trading Services | |
| Traders.com Advantage -- Online Trading Services | |
| Technical Analysis of Stocks & Commodities -- Publications and Newsletters | |
| Working Money, at Working-Money.com -- Publications and Newsletters | |
| Traders.com Advantage -- Publications and Newsletters | |
| Professional Traders Starter Kit -- Software | |
PRINT THIS ARTICLE

Request Information From Our Sponsors
- StockCharts.com, Inc.
- Candle Patterns
- Candlestick Charting Explained
- Intermarket Technical Analysis
- John Murphy on Chart Analysis
- John Murphy's Chart Pattern Recognition
- John Murphy's Market Message
- MurphyExplainsMarketAnalysis-Intermarket Analysis
- MurphyExplainsMarketAnalysis-Visual Analysis
- StockCharts.com
- Technical Analysis of the Financial Markets
- The Visual Investor
- VectorVest, Inc.
- Executive Premier Workshop
- One-Day Options Course
- OptionsPro
- Retirement Income Workshop
- Sure-Fire Trading Systems (VectorVest, Inc.)
- Trading as a Business Workshop
- VectorVest 7 EOD
- VectorVest 7 RealTime/IntraDay
- VectorVest AutoTester
- VectorVest Educational Services
- VectorVest OnLine
- VectorVest Options Analyzer
- VectorVest ProGraphics v6.0
- VectorVest ProTrader 7
- VectorVest RealTime Derby Tool
- VectorVest Simulator
- VectorVest Variator
- VectorVest Watchdog


