

HOT TOPICS LIST
- Strategies
- Stocks
- Buy
- Investing
- Brokers
- Psychology
- Interviews
- Accumulate
- Sell
- Hold
- Spotlight
- Websites
- Candlestick Corner
- Gold & Metals
- Options Trading
LIST OF TOPICS
THE CHARTIST
Continuation Triangles With Fibonacci Targets
09/08/04 03:20:46 PM PSTby J. Mark Kinoff
Triangles should continue the trend in motion.
| Triangles and wedges are often categorized as continuation patterns, areas where the market consolidates before resuming its current trend. Continuation triangles are one of my favorite patterns, and one of the easiest to recognize. When triangles or wedges confirm that a trend is continuing, you can use a simple breakout for your trade entry and a Fibonacci ratio calculation to determine the optimal target area to exit the trade profitably. By trailing a stop until the target is hit, losses will be kept at a minimum and profits will be maximized. On occasion, you may choose to place multiple contracts at the entry point, exit some of them at the optimal target area, and trail a stop on the rest in an effort to catch a larger portion of the longer time frame trend. This is a basic targeted trading strategy. Many technical analysts have speculated on the percentage of triangles or wedges that continue, rather than reverse, the trend. The numbers vary, but most agree that statistics favor a continuation of the trend. This article will look at trading continuation moves out of triangles. Most traders have an opinion about which direction the market will trade on any given day. While that may be helpful on those occasions when they happen to be correct, it is not necessary for profitable trading. The majority of traders do not need to know where a market will be trading in the future to make money consistently. Trading is about using natural market forces; markets follow a predictable and orderly path frequently enough to allow profitable trading. We only need to know the possible outcomes when placing a trade. Knowing such outcomes while combining them with proper risk management will increase profitability. There would be many mornings that a few other floor traders and I would ponder the likely direction of the market for the day. We would try to predict the opening from the information gathered from the cash prices of the previous afternoon session (after the futures market closed). Some would look at the thin overnight trading to get an idea of direction, while others used different leading indicators such as the foreign currencies, metals, or even the price of crude oil or stock indexes. From watching all these floor traders, I learned that holding an established opinion can actually reduce one's overall success in trading. When you ask several floor traders where prices will go today, they will each usually have an underlying opinion — but the most successful among them simply reply, "I don't care as long as I make some money today." Doesn't it make sense to follow this strategy? Most days, floor traders read the order flow for clues on short-term direction. We know at what point we should find support or resistance, or where we are likely to encounter stops. Many of us will look at the charts when we arrive on the floor in the morning to check some key price areas. Others will actually work off their charts, using short-term time frames with some attention even given to weekly charts. Because bond floor traders regularly trade from 3,000 to 10,000 contracts on any given day, the difference between a losing day and a profitable day can be a matter of identifying a very brief continuation pattern and trading with it. Identifying a continuation pattern will allow a trader to profit without having any idea where the market will be at the end of the day, and this is what I want to illustrate with the continuation triangle. Markets go through two dominant phases: range expansion and range contraction. Range contraction is also referred to as congestion or consolidation. It is a constricted price area where the market will trade for a period of time. Range expansion occurs when price moves dramatically in either direction, after which it often finds a new price level to establish another range contraction. The simplest and most effective time to enter a market is after a contraction phase and at the beginning of an expansion phase. I want to have my stops in place while the markets are quiet, and exit my positions when the market has run to its new level. This gives me minimal risk and slippage on my entry, and offers positive slippage when exiting the market while it is still moving in my favor. The common triangle is essentially just such a period of range contraction, where the trading range narrows toward a single central price (or apex), leaving a triangular shape on the chart. After studying the examples in this article, with some practical application, you should be able to see triangles as they are forming.
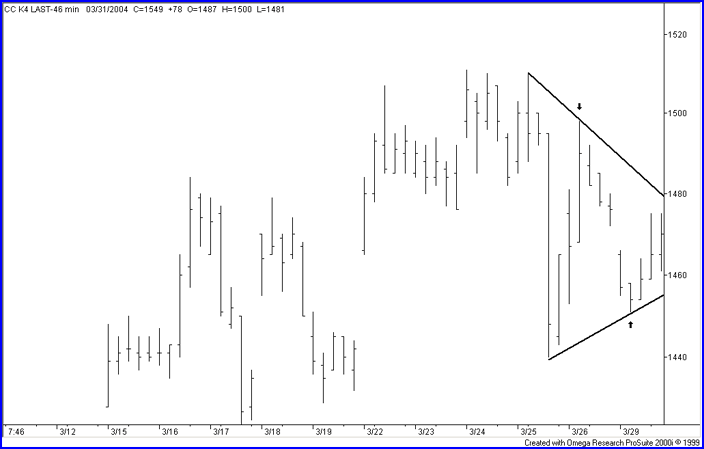
Entry rulesWhile flipping though some intraday charts on TradeStation 2000i, I spotted a triangle in the late stages of formation in the May 2004 cocoa futures. In Figure 1, we see that the market was forming a triangle after a move higher. Because in real time we only know that there is a range contraction (we don't know whether it will be a continuation or reversal pattern), we start to place our stops above or below the last touches of price on the triangle (depending on the direction of the trend prior to the formation of the triangle). Only pivot highs and pivot lows are used when constructing the lines of a triangle. A pivot high occurs when the high of both the preceding and the following bar are lower than the pivot bar's high. The reverse is true for a pivot low. As you can see on the chart, these bars are used to delineate the boundary lines of the triangle. As soon as there are enough points to draw two lines with opposing slopes (a minimum of two touches on each line), we have a possible triangle trade in the works.
Figure 1: Drawing the triangle. The lines were constructed using the last swing high and low and the next pivot bars.
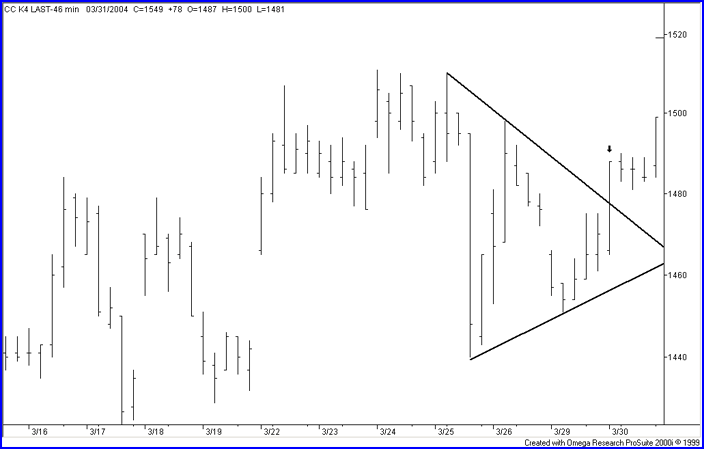
Figure 2 is a 46-minute bar chart. I prefer 46-minute bars in cocoa because they break the trading session into five equal time periods, but the formation can be seen on any period intraday chart. When price breached the upper trendline without taking out the high of the second touch on the upper trendline, it formed my favorite triangle pattern. This is one with three touches on one line and two touches on the opposing line. While two touches on each line is fine for trade selection, I personally prefer triangles with three touches on one line, as these give me a clue as to the direction in which the breakout will occur.
Figure 2: Placing entry orders. The buy stop, in this case, is moved down when we trade above the triangle without taking out the previous high pivot.
As seen in Figure 2, the cocoa chart printed a bar that penetrated the upper line of the triangle (at the arrow on the chart). This was the third touch, and it led me to believe that the breakout would be to the upside. While the bar was still being formed, the long entry would have been five ticks above the high of the second touch. Once the bar closed without triggering that stop, a new buy stop would be placed five ticks above the high of the third-touch bar. In this case, the high of the third-touch bar was 1490, so the stop would be set at 1495. The stop was hit during the formation of the last bar in Figure 2. I was using a mental entry stop, and as luck would have it, when I got to the phone we had printed 1495 and the market was backing off. I placed an order and bought at the market. I was filled at 1490. The market closed shortly thereafter (while I was still calculating my exit targets).
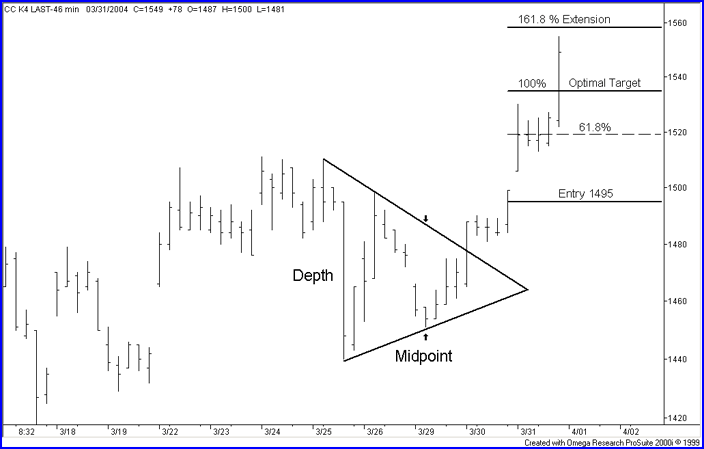
Exit rulesFigure 3 demonstrates the simple exit rules for this method. Following these rules will help increase your odds of properly managing this trade by taking out all the emotion. They are simple, yet quite effective, and they should increase your edge over the markets. Here is where the Fibonacci ratio comes into the equation:
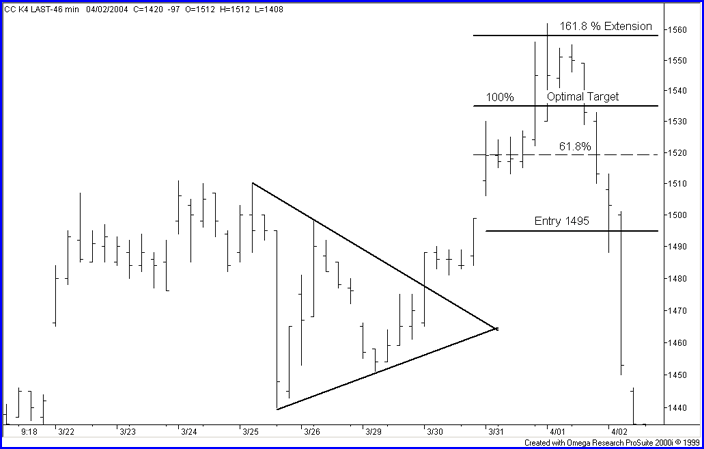
Figure 3: Managing the trade. Once we have entered the trade, we calculate the stops and profit targets using the rules.
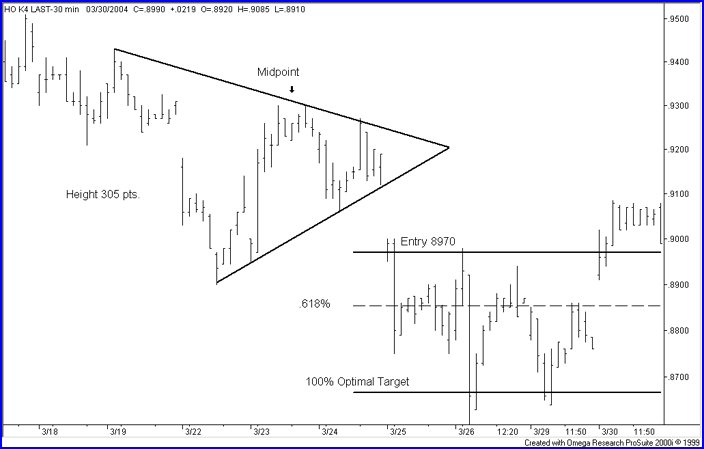
In Figure 3, the opposing arrows at the midpoint represent 50% of the time elapsed from the base of the triangle calculated from the longest side to the apex (where the lines will intersect). At this midpoint, we calculate the height of the triangle in points. The height is the distance in price between the upper trendline and the lower trendline at the midpoint of the triangle. The entry for the long trade is at 1495, which is five ticks above the last high that either touched or penetrated the upper line. Our initial stop would be just below the apex, which in this case is 1464. Please note — it does not matter where the fill was! Too many traders relate their stop-loss set point to their fill, but there is no correlation between them. Always place the stop just beyond the apex of the triangle. Then take what the market gives you. To calculate the Fibonacci targets, use the ideal entry point. To determine this point, first add the height of the triangle to the midpoint height to derive the optimal target. In this case, the midpoint height of the triangle was 39 points, so the optimal target was 1534 (the ideal entry price of 1495 plus the midpoint height of 39 points). In a strongly trending market (defined by many other available indicators), we would likely see the upper extension target reached. This price target is calculated by multiplying our midpoint height of 39 by the Fibonacci ratio 1.618, and adding it to our entry price, that is, 1495 + (39 * 1.618). This equals approximately 1558. If we were to reach that point, I would expect to see a reversal and wait for another congestion pattern to reenter the market. In this fashion, we merely enter the market at the end of a range contraction and exit on a range expansion, with no particular concern about where the market will ultimately go. To maximize the effectiveness of stop-loss placement, start by placing the stop just beyond the apex of the triangle on the side opposite the entry. For a long position, once we trade above the highest high in the base (1519 in this example), we move our stop to just below the low of the entry bar (in this case, 1484). We would proceed in a similar (but opposite) fashion if the breakout had been to the downside. Following this process lowers the amount at risk if the pattern should happen to fail. Because I did not have any confirmation from other indicators that this would be a strong market, I chose to take my money off the table at the optimal target and to look for another good setup. Strict money management rules will improve the rate of success for the individual trader. The patterns and rules I have described take the emotions out of trading and will allow you to be disciplined in your approach to the markets. The less you care about direction and the more you focus on using proper techniques and discipline to let the market take you into and out of trades, the more rewarding your efforts will be. See Figures 4 and 5 for two more examples.
Figure 4: Price reversing at target areas. Price often reverses at target areas.
J. Mark Kinoff is a CTA, a member of the Chicago Board of Trade, and has traded bonds, grains, and the Dow Jones Industrial Average as a floor trader. His website is www.Corefutures.com, and he can be reached at Jck@Corefutures.com. TradeStation
Current and past articles from Working Money, The Investors' Magazine, can be found at Working-Money.com.
|
| Title: | CTA |
| Website: | www.Corefutures.com |
| E-mail address: | JCK@Corefutures.com |
PRINT THIS ARTICLE

Request Information From Our Sponsors
- StockCharts.com, Inc.
- Candle Patterns
- Candlestick Charting Explained
- Intermarket Technical Analysis
- John Murphy on Chart Analysis
- John Murphy's Chart Pattern Recognition
- John Murphy's Market Message
- MurphyExplainsMarketAnalysis-Intermarket Analysis
- MurphyExplainsMarketAnalysis-Visual Analysis
- StockCharts.com
- Technical Analysis of the Financial Markets
- The Visual Investor
- VectorVest, Inc.
- Executive Premier Workshop
- One-Day Options Course
- OptionsPro
- Retirement Income Workshop
- Sure-Fire Trading Systems (VectorVest, Inc.)
- Trading as a Business Workshop
- VectorVest 7 EOD
- VectorVest 7 RealTime/IntraDay
- VectorVest AutoTester
- VectorVest Educational Services
- VectorVest OnLine
- VectorVest Options Analyzer
- VectorVest ProGraphics v6.0
- VectorVest ProTrader 7
- VectorVest RealTime Derby Tool
- VectorVest Simulator
- VectorVest Variator
- VectorVest Watchdog