

HOT TOPICS LIST
- Strategies
- Stocks
- Buy
- Investing
- Brokers
- Psychology
- Interviews
- Accumulate
- Sell
- Hold
- Spotlight
- Websites
- Candlestick Corner
- Gold & Metals
- Options Trading
LIST OF TOPICS
FOCUS ON
Gold's Last Gasp? Part I
09/22/04 04:04:53 PM PSTby David Penn
Could a massive, multiyear correction be just around the corner in gold?
| Most who keep track of gold prices have also kept track of Elliott wave theorist Robert Prechter's thesis that a major deflation — which would be bearish for gold — is more likely than a major inflation — which would be bullish for gold. However, many market observers have come to believe that this thesis is so outrageous that both "buy and hold" CNBC types and gold bugs have enjoyed ridiculing his notion that, as Prechter wrote:
According to our long-standing target, gold still ultimately needs to fall to below $200/oz., probably close to $100, in order to complete the Supercycle bear market that began in 1980. Having seen the wave count provided years ago in At The Crest Of The Tidal Wave (and precious little else since), I have been trying to map out just how we might get from a gold price that in recent days has remained persistently above $400 to a gold price that would be lucky to stop falling at $150 an ounce. What follows is one crack at that map. The secular bull market in gold from 1967 to 1980 has been well-chronicled in a number of places — including A.J. Frost and Prechter's Elliott Wave Principle. While not providing a great deal of documentary discussion about the "fundamentals" and psychology of the gold market at the time, EWP does a particularly strong job of describing the gold move from its wave 4 low in 1978 to its wave 5 peak in 1980. On the other hand, the secular bear market in gold that began in 1980 has probably been best described by supply side economist Jude Wanniski of Polyconomics.com. Wanniski, who uses the price of gold as a primary indicator of inflationary and deflationary pressures, tells a tale of vacillating monetary policy as supply side theorists and monetarists battled for intellectual control of the nation's (and by some extension, the world's) economy. For those looking for a blow-for-blow account of the monetary battles of the 1980s as they related to the price of gold (and Wanniski would remind us that monetary policy and the price of gold are fundamentally linked), you won't find too many accounts more compelling than Wanniski's. But insofar as our concern here is technical, not fundamental, this story of the secular bear market in gold is a story of a complex correction — arguably the most complex of all possible corrections. In fact, it is the complexity of this correction that helps explain both the utter disdain that conventional mainstream economists have for the yellow metal, as well as, ironically, the never-say-die faith of gold bugs who have been repeatedly fooled by bear market rallies into thinking that the type of gold market we saw in the final wave of gold's secular bull market is all but at hand.
Complex correctionsOne of the tenets of technical analysis might be called the "Quacks like a duck" thesis. By that I mean that much of what technical analysis does is encourage observers to see the markets for what they are — as opposed to what we've heard they might be or what we might want them to be. In other words, if it walks like a duck and quacks like a duck, then it's probably a duck. We see examples of this sort of thinking throughout technical analysis: uptrends are, commonsensically enough, built on higher highs and higher lows; buying at support and selling at resistance sounds logical, even to those who barely understand what technical support and resistance means. This is the stuff that drives technicians crazy when confronted by those who insist that technical methods of reading the markets are "mumbo-jumbo" or "tea-leaf reading." But even the alleged complexity of Elliott wave analysis has, at root, the same commonsensical approach to price action. For example, if an Elliottician is looking at a difficult to interpret price pattern, then it is quite possible that it is a difficult — or complex — price pattern. And fortunately, Elliott wave analysis provides a number of tools to help Elliotticians plot a reasonable wave count until the picture becomes clear enough to act with confidence and precision. Looking at the secular bear market in gold, I note that the bear market began with a sharp decline from the 1980 high to the low in 1982. This decline was in the form of a zigzag, a common corrective pattern consisting of three waves, which themselves are subdivided into a five-wave A segment, a three-wave B segment, and a final five-wave C segment. The classic example of a zigzag correction is the 1929 stock market crash and, like that crash, the zigzag correction in gold was devastating in its decline. Recall that gold fell from a 1980 price in excess of $850 to a 1982 price just north of $300 — a 64% decline. However, in the context of a market that has moved largely sideways for more than 10 years, it is clear that this initial zigzag was hardly the end of the bear market in gold. For Elliotticians, the clearest indication that this was not the case came with the 1982 low which, while severe relative to the 1980 peak, did not reach the level of the previous wave 4 low in 1978 (approximately $100 per ounce!). Note that the subsequent low in 1985 was only mildly lower than the low in 1982. Because of this rule about corrections, Elliotticians warned gold bugs that the worst for gold was far from over and that any rallies in gold would be simply bear market rallies until gold corrected down to its previous wave 4 level — $100 per ounce.
From true low to "true low"If gold's five-part secular bull market from 1967 to 1980 represented a first secular wave in gold (a bull market that appears to have begun years before gold and the US dollar were officially uncoupled in 1971), then the secular bear market that began in 1980 was likely to be a second secular wave. With the bear market as a second wave, there are a few analytical options available from an Elliott wave perspective. The second secular wave could be a zigzag correction, a flat correction, or something more complex such as a double three (arguably, a triangle correction would also be a possibility).
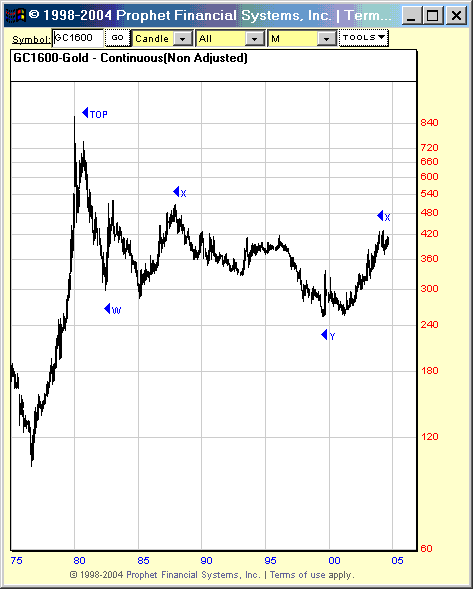
Figure 1: The secular bear market in gold, with the major WXYXZ wave pivots of the double 3 noted (save for the final wave "Z" low), has repeatedly sent gold bugs on a fool's errand in search of higher prices.
A number of these possibilities remained viable as gold moved higher and higher in the second half of the 1980s. However, when gold peaked late in 1987 and began falling (along with the stock market, which entered a sort of rolling bear market that would last into 1991), hopes for certain milder corrections — such as a flat that would have limited gold's declines to approximately the 1985 level — were dashed. The prospect of a zigzag that would take gold down to the feared wave 4 level increasingly seemed likely. If there was any relief for gold bugs who took to heart the message that gold's secular bear market would be a zigzag, then at least those bugs knew the correction would be over relatively quickly. But as markets tend to be, little satisfaction could be found on either side of the gold battle. Rather than embark again on another steep 1980-82 style crash, gold slid gradually lower, as if on a gentle 45-degree grade for five years, never quite reaching the 1982-85 lows near $300 — much less the wave 4 low at $100. In fact, after five years of meandering lower, gold found support near $325 and spent the middle part of the 1990s actually moving higher — albeit only to the $400 gold mark. This, nevertheless, was plenty for gold bugs never really happy about forecasts of $100 gold. A number of doomsday books — most interestingly, The Great Reckoning: Protecting Yourself in the Coming Depression by James Dale Davidson and Lord Williams Rees-Mogg — appeared on the bookshelves (though Prechter's offering at the time, At The Crest Of The Tidal Wave, was among the few to point to a deflationary outcome that would produce lower gold prices rather than an inflationary one that would produce higher gold prices). And amid all of the various and well-argued reasons for the coming economic disaster, one solution for average investors was consistently underscored in all the non-Elliott tomes: buy gold.
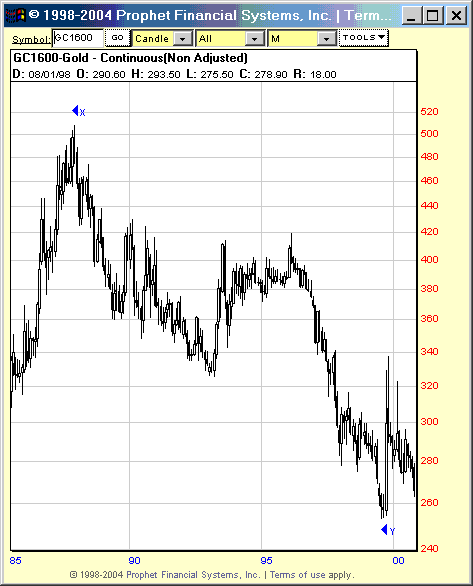
Figure 2: The resumption of the secular bear market in gold in 1987 nearly disillusioned a generation of gold bugs. By the time of the wave Y low in 1999, governments were trying to force themselves to slow gold sales, and gold mining companies had resorted to derivative trading in order to make money.
Unfortunately for those following that advice, the bear market in gold resumed in the final third of the 1990s as gold topped out just shy of $425 and began another slow, agonizing slide. This time, however, gold bugs were finding real reason for despair. By 1997, gold had fallen below not only its early 1990s low near $325, but also below its mid-1980s low near $300. To make matters worse, financial assets were once again soaring — much as they did in the 1982-86 period. One imagines that the gold bugs wouldn't have been quite so despondent about their eroding positions in gold if stock and mutual fund buyers were suffering along side them. In the absence of that suffering, the only crying was coming from the COMEX gold pits. So bad had the situation gotten in the late 1990s, the central banks mutually agreed to limit gold sales (technically, gold "leasing") with the so-called Washington Agreement. While gold bug skeptics often accused central banks of cheating — the bugs still unhappy that now gold mining companies were using derivatives to profit off of a falling gold price (the ignominy!) — the fact of the matter is that gold bottomed near $250 in the weeks and months following the agreement. This bottom concluded the 3-3-5 "flat" correction of wave Y circa 1987-99. Incidentally, the Washington Agreement is set to expire in September 2004 — though a number of European central banks have pledged to renew it.
Next in Part II: A comparison of the X waves and more on the prospects for sub-$200 gold.
David Penn may be reached at DPenn@Traders.com.
Suggested readingDavis, Mark [1982]. "'Goldbugs' Crawl Out Of The Woodwork," Commodities, November.Fischer, Robert [1993]. Fibonacci Applications And Strategies For Traders, John Wiley & Sons. Frost, A.J., and Robert Prechter Jr. [1978]. Elliott Wave Principle, New Classics Library. Jett, Wayne [2003]. "A Supply-Side History And The Road Ahead," Polyconomics.com: August. Prechter, Robert Jr. [1995]. At The Crest Of The Tidal Wave, New Classics Library. Stewart, Janeen [1987]. "What's Next For Silver?" Futures, July. Tanzy, Kathleen [1987]. "Ruckus Over Gold Overdone," Futures, November. Wanniski, Jude [1995]. "A Gold Polaris," Polyconomics.com: March. Charts courtesy of Prophet Financial Systems
Current and past articles from Working Money, The Investors' Magazine, can be found at Working-Money.com. |
Technical Writer for Technical Analysis of STOCKS & COMMODITIES magazine, Working-Money.com, and Traders.com Advantage.
| Title: | Traders.com Technical Writer |
| Company: | Technical Analysis, Inc. |
| Address: | 4757 California Avenue SW |
| Seattle, WA 98116 | |
| Phone # for sales: | 206 938 0570 |
| Fax: | 206 938 1307 |
| Website: | www.traders.com |
| E-mail address: | DPenn@traders.com |
Traders' Resource Links | |
| Charting the Stock Market: The Wyckoff Method -- Books | |
| Working-Money.com -- Online Trading Services | |
| Traders.com Advantage -- Online Trading Services | |
| Technical Analysis of Stocks & Commodities -- Publications and Newsletters | |
| Working Money, at Working-Money.com -- Publications and Newsletters | |
| Traders.com Advantage -- Publications and Newsletters | |
| Professional Traders Starter Kit -- Software | |
PRINT THIS ARTICLE

Request Information From Our Sponsors
- StockCharts.com, Inc.
- Candle Patterns
- Candlestick Charting Explained
- Intermarket Technical Analysis
- John Murphy on Chart Analysis
- John Murphy's Chart Pattern Recognition
- John Murphy's Market Message
- MurphyExplainsMarketAnalysis-Intermarket Analysis
- MurphyExplainsMarketAnalysis-Visual Analysis
- StockCharts.com
- Technical Analysis of the Financial Markets
- The Visual Investor
- VectorVest, Inc.
- Executive Premier Workshop
- One-Day Options Course
- OptionsPro
- Retirement Income Workshop
- Sure-Fire Trading Systems (VectorVest, Inc.)
- Trading as a Business Workshop
- VectorVest 7 EOD
- VectorVest 7 RealTime/IntraDay
- VectorVest AutoTester
- VectorVest Educational Services
- VectorVest OnLine
- VectorVest Options Analyzer
- VectorVest ProGraphics v6.0
- VectorVest ProTrader 7
- VectorVest RealTime Derby Tool
- VectorVest Simulator
- VectorVest Variator
- VectorVest Watchdog