

HOT TOPICS LIST
- Strategies
- Stocks
- Buy
- Investing
- Brokers
- Psychology
- Interviews
- Accumulate
- Sell
- Hold
- Spotlight
- Websites
- Candlestick Corner
- Gold & Metals
- Options Trading
LIST OF TOPICS
FOCUS ON
Election 2004: A Tale Of Two Tops
10/06/04 03:18:28 PM PSTby David Penn
The nine-month trading range of 2004 resembles a similarly extended trading range from 2000.
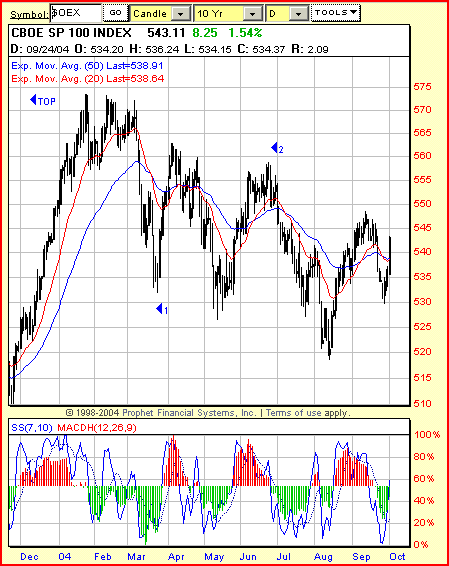
| When the broader stock market peaked in the spring of 2000, it was not until the autumn of that year that some investors and traders dared to whisper the dreaded "b-word": bear market. This phenomenon has worthwhile implications for those looking at the markets in the last quarter of 2004. Like the late Marlon Brando's invocation of a snail crawling down the length of a razor blade (from his mesmerizing monologue as the tortured Colonel Kurtz in the movie Apocalypse Now), the broader stock market in 2004 has given every appearance of something that wasn't quite right, something that — in some sense — should not be quite what it was. After all, as more than a few veteran market observers quipped when talking of the market in 2004: Give me a bull market, give me a bear market, but just give me something. What has the market given traders in 2004? Let's use the $OEX or Standard & Poor's 100 as our broader market proxy. After topping out in late January at 573, the $OEX:
With the $OEX finishing September at about 535, what we are left with is nine months of market activity. What did we get for those nine months? Try just under 40 points' worth of difference. While 40 points in nine months isn't insignificant if you are starting from 573 (a 7% change or a little more than 9% annualized), it is something else altogether if those 40 points comes in a zigzagging market characterized less by investor conviction and more by investor confusion (that is, persistently low volume, low options volatility, and a lack of stock "leadership"). What is interesting is that this type of trading range, in which a clear pattern of lower highs and lower lows nevertheless refuses to give way to a coherent downtrend, is reminiscent of the trading range that marked the end of the bull market of the 1990s. For those who waited patiently for the bear market rally of 2003 to end and have been waiting somewhat less patiently for the current topping process to give way to a "market-falling-down-the-stairs" process — keeping the year 2000 in mind might go a long way toward easing nerves otherwise frayed by a market that knows it can't go much higher, but isn't prepared to collapse — not quite yet.
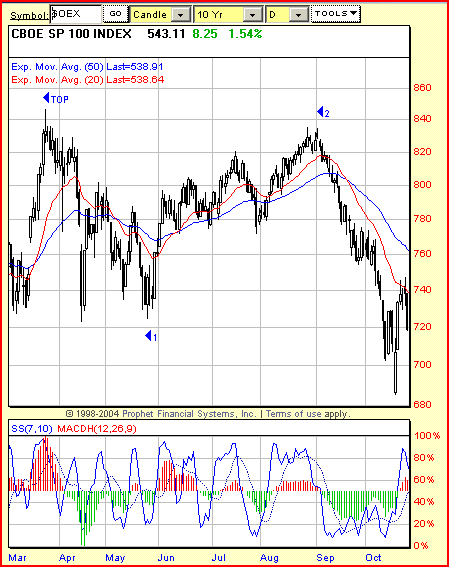
2000: A market odysseyI don't mean to make a catechism of Elliott wave theory, but it is particularly helpful here as a form of cartography to show the similarity between the current market environment and the one in 2000. In both instances, the market had recently completed a strong rally (2003 and 1999, respectively), and some degree of consolidation was to be expected. In 2000, the market meandered lower from March to late May before making a broadening, jagged advance until mid-August. Wave theorists generally counted the initial decline from the March 2000 high to the lows in late May as a wave one decline, with the rally from the May lows to the high in late August representing a wave two (bear market) rally.
Figure 1: Topping out in late March, it was not until October that the $OEX broke down convincingly beneath the wave one lows.
One interesting fact is that it appears as if the 2004 election will be held under similar conditions (in the short term) as the 2000 election — as far as the wave count is concerned. By my counting of the market's current environment, a wave one low was made early in March 2004, with a wave two peak established during the June 2004 highs. The decline into the August lows and subsequent rally, then, represent the first two waves of a sizable bearish third wave. And it appears as if the November election will take place in a similarly "early" stage of this eventually destructive third wave. The 2000 election, by comparison, occurred early in a third wave decline — apparently not early enough for the sort of "aggressive denial" and defiant optimism that characterizes rallies in corrective phases (such as "b" waves in ABC corrections or two and four waves in five-wave bull markets), but not so late as to invoke the wrath of declining third waves. Such third waves tend to be devastating by the time they reach their conclusion, as I have noted elsewhere.
And the declining third wave that began in August 2000 and ended in spring 2001 was no exception. By April 2001, the S&P 100 was down 31% from its highs of a year before, with the attendant negative social mood was close behind. Recall that it was in April 2001 that President Bush was confronted with his first major foreign policy crisis: the forced landing of an American spy plane in China and the 10-day detention of the crew by Chinese authorities.
Mixed markets and mixed messagesIn some ways, it is easier to describe where we are in terms of the broader market by using the language of psychology rather than the necessarily equivocal, "if-then" language of the trader. In part this is because psychology is elastic and allows for the "sloppiness" of human behavior in ways that other analytic approaches do not. For example, the market has clearly made a nine-month series of lower highs and lower lows since 2004 began. This is by definition a downtrend, and given the length of this series of lower highs and lower lows, is accurately thought of as a bear market.
Figure 2: Per this wave count of the $OEX in 2004, the S&P 100 is still relatively early in what should turn out to be a devastating third-wave decline.
To say it is a bear market does not quite capture the conflicting impulses of fear and greed that are still slugging it out for control of the hearts and minds of the investing and speculating public. However, if we note that the "aggressive denial" and defiant optimism observable in much of the population at present is a characteristic that appears late in bullish second waves and lingers into the early stages of bearish third waves, then much of what we see — in politics, in economics — becomes far more understandable (and arguably, fit for forecast). This is the kind of analysis, for example, that has allowed Elliott wave theorists like Robert Prechter to anticipate the impeachment of former President Bill Clinton in 1998 as the market moved from buoyancy to mini-crash late in the year. While I don't know how many Elliott wave theorists anticipated the closeness of the 2000 Presidential contest based on the location of the election in the topping process, the relationship between the 2000 contest and its wave location should prove helpful in looking at the 2004 contest, which is located similarly. Until the broader market starts making higher intermediate highs — which it has not done since early January — the path of least resistance remains downward. The present outlook is sufficiently bearish that, were the markets to provide any indication of real bullishness, it would be difficult not to notice. By far the greater danger is a lack of preparedness for any increased volatility to the downside. Will this increased volatility to the downside be sufficient to bring about the kind of loathing and revulsion that would be required to remove an incumbent President? I have joked with friends that John Kerry might be time decay personified, but unless and until the market resumes moving downward with conviction, the joke will likely remain on Senator Kerry and the Democrats.
David Penn may be reached at DPenn@Traders.com.
Suggested readingFrost, A.J., and Robert Prechter [1985]. Elliott Wave Principle, New Classics Library.
Charts courtesy of Prophet Financial Systems
Current and past articles from Working Money, The Investors' Magazine, can be found at Working-Money.com.
|
Technical Writer for Technical Analysis of STOCKS & COMMODITIES magazine, Working-Money.com, and Traders.com Advantage.
| Title: | Traders.com Technical Writer |
| Company: | Technical Analysis, Inc. |
| Address: | 4757 California Avenue SW |
| Seattle, WA 98116 | |
| Phone # for sales: | 206 938 0570 |
| Fax: | 206 938 1307 |
| Website: | www.traders.com |
| E-mail address: | DPenn@traders.com |
Traders' Resource Links | |
| Charting the Stock Market: The Wyckoff Method -- Books | |
| Working-Money.com -- Online Trading Services | |
| Traders.com Advantage -- Online Trading Services | |
| Technical Analysis of Stocks & Commodities -- Publications and Newsletters | |
| Working Money, at Working-Money.com -- Publications and Newsletters | |
| Traders.com Advantage -- Publications and Newsletters | |
| Professional Traders Starter Kit -- Software | |
PRINT THIS ARTICLE

Request Information From Our Sponsors
- StockCharts.com, Inc.
- Candle Patterns
- Candlestick Charting Explained
- Intermarket Technical Analysis
- John Murphy on Chart Analysis
- John Murphy's Chart Pattern Recognition
- John Murphy's Market Message
- MurphyExplainsMarketAnalysis-Intermarket Analysis
- MurphyExplainsMarketAnalysis-Visual Analysis
- StockCharts.com
- Technical Analysis of the Financial Markets
- The Visual Investor
- VectorVest, Inc.
- Executive Premier Workshop
- One-Day Options Course
- OptionsPro
- Retirement Income Workshop
- Sure-Fire Trading Systems (VectorVest, Inc.)
- Trading as a Business Workshop
- VectorVest 7 EOD
- VectorVest 7 RealTime/IntraDay
- VectorVest AutoTester
- VectorVest Educational Services
- VectorVest OnLine
- VectorVest Options Analyzer
- VectorVest ProGraphics v6.0
- VectorVest ProTrader 7
- VectorVest RealTime Derby Tool
- VectorVest Simulator
- VectorVest Variator
- VectorVest Watchdog