HOT TOPICS LIST
- Strategies
- Stocks
- Buy
- Investing
- Brokers
- Psychology
- Interviews
- Accumulate
- Sell
- Hold
- Spotlight
- Websites
- Candlestick Corner
- Gold & Metals
- Options Trading
LIST OF TOPICS
THE OPTIMIZED TRADER
Dr. Reversal And Mr. Support
10/13/04 03:33:29 PM PSTby David Penn
What do you do when a riot of technical indicators and setups suggests that a market has run out of upside in the near term?
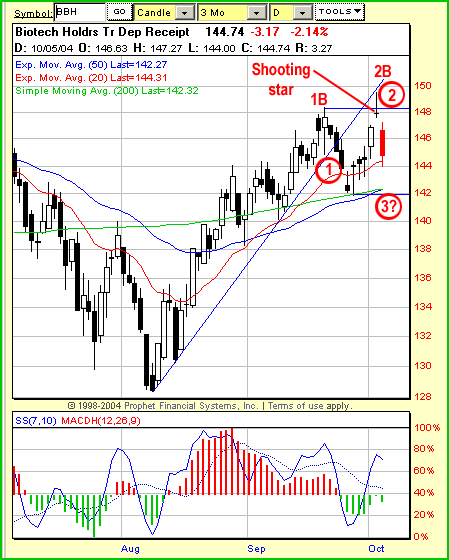
| The case for a reversal in biotechnology stocks, which have been enjoying a six-week rally, hinges on four major technical developments: a running negative stochastic divergence, a 1-2-3 trend reversal, a 2B test of top or "Turtle Soup Plus One" setup, and a shooting star candlestick. There is one significant argument against in the form of tripartite moving average support (the 20-, 50- and 200-day moving averages, to be specific). Here, we'll run down each technical development to see whether the odds against the rally in biotechnology shares are getting steeper.
The negative stochastic divergence: This bearish indication for the biotechnology group has been forming for several months (we'll use the HOLDR BBH as the biotech proxy). The 7,10 stochastic made its peak for the move ("the move" being the August/September rally) back near the middle of August. Since then, the stochastic has gone on to mark lower highs in the middle of September and again (apparently) in early October. At the same time, BBH has been marking a series of higher peaks in mid-August, mid-September, and (apparently) in early October. While negative stochastic divergences can be tricky to trade during strong uptrends, the fact remains that such divergences are often warning signals of impending weakness at a minimum, if not outright reversal.
Figure 1: Four factors against and one for? The divergence, trend reversal, failed breakout, and shooting star augur lower prices. But moving averages could provide sorely needed support.
The 1-2-3 trend reversal: This trend reversal setup comes courtesy of Market Wizard Vic Sperandeo (see his Methods Of A Wall Street Master). I've written about it frequently for Traders.com Advantage. Essentially, the setup suggests that when a trendline is broken (1), prices will first attempt to resume the "old" trend (2). Failing that, prices will retreat to test what I call the "post-trendline break low" (3). The 1-2-3 trend reversal is said to be complete if all three of these developments take place. At present, BBH has shown two of these characteristics and is moving toward the third. BBH broke through its uptrend line in late September and spent the first few days of October trying to retake higher ground. It appears as if BBH has failed to make and hold a new high and is now headed for stage (3): a test of the post-trendline break low at 142.
The 2B top: This is another trend reversal setup that's been observed by a number of technical analysts. Sperandeo refers to it as "2B," while Larry Connors in his Street Smarts (co-authored with Linda Bradford Raschke) calls a similar setup (alternately), "Turtle Soup" and "Turtle Soup Plus One." The main point behind the 2B and Turtle Soup setups is embodied in the observation made by another technical analyst of note, Pristine.com's Oliver Velez, who once quipped that "amateurs buy new highs; pros sell new highs." To wit, when new highs are made, if there is a failure of prices to immediately follow through to the upside, then there is a significant chance that the market is vulnerable to reversal. While many people using such setups include other technical factors (not the least of these being the relative length or "maturity" of a given market), the 2B test is one way that traders and investors can spot potential major market turns. In the present case, BBH set a high in mid-September, which was followed by a higher high early in October. Here, the failure to follow through to the upside was pronounced, as BBH reversed sharply after setting the higher high in October. Entry rules for the 2B/Turtle Soup setup vary, with the most aggressive rules calling for an entry at the level of the previous high (the mid-September high, in this case). A trader following this aggressive strategy would have likely been filled near the open and ended the day with a near 2% gain.
The shooting star: Even the candlesticks are conspiring against the rally in biotechnology stocks (at least, as represented by BBH). Here, the candlestick in question is the one that formed the stage (2) of the 1-2-3 trend reversal, and the second higher high in the 2B/Turtle Soup setup, both of which have already been discussed. This candlestick has taken the form of a shooting star, a bearish reversal candlestick that features a long upper shadow and a relatively small real body. The shooting star, when appearing late in a rally, tends to reflect a failed attempt by buyers to move prices higher. When such a failure occurs at that time, candlestick-oriented traders begin to consider the possibility that buying strength has been depleted and a reversal is increasingly likely. The shooting star is one of those candlesticks that most traders can spot at a hundred paces, which underscores both its benefits and its dangers when used as a trading signal. That most chart readers can spot a shooting star means that there is no mystery as to what is supposed to happen afterward. And it doesn't take a rereading of the Heisenberg uncertainty principle to fear that with so many eyes all watching for the same thing to happen, the possibility of it actually not happening might be larger than any dare admit. Nevertheless, the 2% drop on the day following the shooting star might be enough to convince skeptical traders that the obvious and the real might be one and the same in this instance.
The moving average support: If there is a fly in all this bearish ointment, then that fly is the trio of moving averages that lie right below the lows of October 5 (the breakdown day). This trio includes a 20-day exponential moving average at about 144, with 50-day exponential and 200-day simple moving averages converging at the 142 level. While it is true that BBH was able to largely ignore these moving averages early in its move (say, back in late August), a close look will show how these moving averages served as support at least twice during BBH's continued advance into September. Once early in the month and again later, declines in BBH halted when they ran into the longer-term moving averages. All three provided support during BBH's early September correction, and the 200- and 50-day moving averages played a strong supporting role during BBH's correction late in September. It should also be mentioned that a similarly supportive performance was provided by the longer-term moving averages in October. Here, while the shortest of this trio of moving averages — the 20-day exponential — was penetrated, the convergence of the longer two moving averages — the 50-day exponential and the 200-day simple — created a powerful source of support. So strong was it that not only was the correction that began in mid-September halted before a new monthly low could be set, but a subsequent rally was able to set a new high (albeit, perhaps, a bit of a bull trap, as discussed previously).
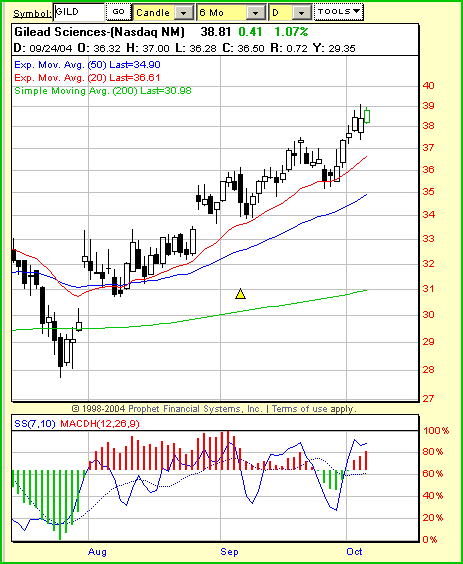
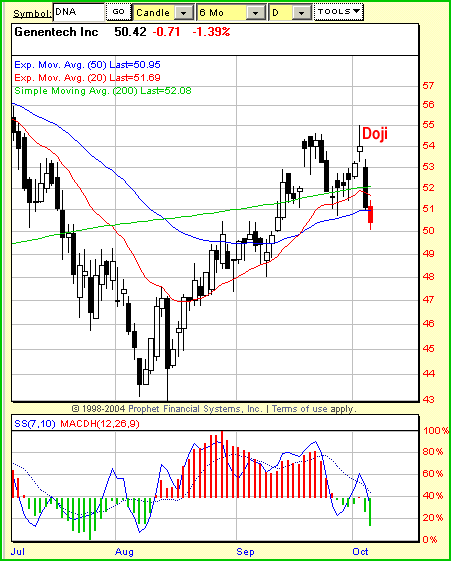
Biotech fellow travelers and dissentersAs far as individual biotechnology stocks that might be displaying the same characteristics as the biotechnology index is concerned, there is a mixed bag. For every biotechnology stock that is soaring above its moving averages, with a stochastic that is in gear with price action (matching peaks and troughs without divergences) and strongly bullish candlesticks, there is one that is below its major moving averages, with growing negative stochastic divergences and the sort of upper shadow or tail in recent daily candlesticks that intimates weakness on the part of the buyers. An example of the former might be a stock like Enzon Pharmaceuticals (ENZO) or Gilead Sciences (GILD). Examples of the latter might include Human Genome Sciences (HGSI), Amgen (AMGN), or Genentech (DNA).
Figure 2: Should the BBH find support at its trio of major moving averages, then look for stocks like GILD to continue moving higher.
Fortunately, all the tools that can be used to determine whether the biotechnology index (or, in this specific case, the biotechnology HOLDRS) will move higher or lower can also be deployed to determine how individual stocks within that index will fare. For example, while GILD is quite extended from its 50-day exponential moving average, the fact that it has not developed a negative stochastic divergence is a positive sign for the stock. After six consecutive updays, a trader long GILD could be forgiven for seeing any low-volume pullback as a buying opportunity rather than as a warning to sell.
Figure 3: The biggest difference between BBH and DNA is that BBH has so far remained above its major moving averages, while DNA has fallen below them.
Conversely, an evaluation of a stock like DNA suggests bearishness similar to what is seen in the broader index of biotechnology stocks. DNA is trading below its 20-, 50-, and 200-day moving averages and features a doji at the beginning of October — a candlestick that, in this context, is no less bearish in its implications than the shooting star was in BBH.
David Penn may be reached at DPenn@Traders.com.
Suggested readingConnors, Laurence A., and Linda Bradford Raschke [1995]. Street Smarts, M. Gordon Publishing Group.Connors, Larry, and Conor Sen [2004]. How Markets Really Work, Trading Markets Publishing Group. Nison, Steve [1994]. Beyond Candlesticks, John Wiley & Sons. Sperandeo, Victor [1991]. Methods Of A Wall Street Master, John Wiley & Sons.
Charts courtesy Prophet Financial systems
Current and past articles from Working Money, The Investors' Magazine, can be found at Working-Money.com. |
Technical Writer for Technical Analysis of STOCKS & COMMODITIES magazine, Working-Money.com, and Traders.com Advantage.
| Title: | Traders.com Technical Writer |
| Company: | Technical Analysis, Inc. |
| Address: | 4757 California Avenue SW |
| Seattle, WA 98116 | |
| Phone # for sales: | 206 938 0570 |
| Fax: | 206 938 1307 |
| Website: | www.traders.com |
| E-mail address: | DPenn@traders.com |
Traders' Resource Links | |
| Charting the Stock Market: The Wyckoff Method -- Books | |
| Working-Money.com -- Online Trading Services | |
| Traders.com Advantage -- Online Trading Services | |
| Technical Analysis of Stocks & Commodities -- Publications and Newsletters | |
| Working Money, at Working-Money.com -- Publications and Newsletters | |
| Traders.com Advantage -- Publications and Newsletters | |
| Professional Traders Starter Kit -- Software | |
PRINT THIS ARTICLE

Request Information From Our Sponsors
- StockCharts.com, Inc.
- Candle Patterns
- Candlestick Charting Explained
- Intermarket Technical Analysis
- John Murphy on Chart Analysis
- John Murphy's Chart Pattern Recognition
- John Murphy's Market Message
- MurphyExplainsMarketAnalysis-Intermarket Analysis
- MurphyExplainsMarketAnalysis-Visual Analysis
- StockCharts.com
- Technical Analysis of the Financial Markets
- The Visual Investor
- VectorVest, Inc.
- Executive Premier Workshop
- One-Day Options Course
- OptionsPro
- Retirement Income Workshop
- Sure-Fire Trading Systems (VectorVest, Inc.)
- Trading as a Business Workshop
- VectorVest 7 EOD
- VectorVest 7 RealTime/IntraDay
- VectorVest AutoTester
- VectorVest Educational Services
- VectorVest OnLine
- VectorVest Options Analyzer
- VectorVest ProGraphics v6.0
- VectorVest ProTrader 7
- VectorVest RealTime Derby Tool
- VectorVest Simulator
- VectorVest Variator
- VectorVest Watchdog


