HOT TOPICS LIST
- Strategies
- Stocks
- Buy
- Investing
- Brokers
- Psychology
- Interviews
- Accumulate
- Sell
- Hold
- Spotlight
- Websites
- Candlestick Corner
- Gold & Metals
- Options Trading
LIST OF TOPICS
TRADER'S NOTEBOOK
Match Your Method To The Market
10/18/04 04:31:32 PM PSTby Steven Palmquist
Each trading style has market conditions in which it thrives. Match 'em and make your profit.
| The probability of a winning trade is affected by the trading system in question, current market conditions, and the trading style. Trading success requires you to be able to analyze the current market conditions and select the most appropriate trading style rather than using the same approach, regardless of market conditions. Each trading style — short-term, swing, and intermediate-term — has market conditions in which it works well and conditions in which it should be avoided. Trading systems also have markets in which they perform well and times in which they do not. The trick to trading is to have the combination of trading system and style that matches the current market conditions. It is well worth the time to carefully analyze how your system performs in uptrending, downtrending, and sideways markets. Don't just backtest the system over a multiyear period; spend time understanding how it works in each of these different conditions. Once you have a set of tools that cover all three market conditions, you must select the appropriate tool and trading style for the current market. In general, it's best to use the longest-term trading technique that the current market conditions will support. This skill takes some time to develop, but it is well worth the effort. Short-term trading involves taking quick profits on the initial move following a pattern or trendline break. Typical holding periods are one to three days. I usually use both a time stop and a fixed-dollar target stop. Short-term techniques can be profitable in narrow range markets that are ineffective for longer-term techniques. Swing trading involves using a stop below the low of the set-up pattern, and trailing the stop as the stock moves up. Swing traders try to profit from moves lasting from three days to three weeks. Swing trading works in wide-range or trending markets, and usually is more profitable than short-term trading in these types of markets. Intermediate-term trading is effective when the market is trending, and should generally be avoided in range-bound markets. Intermediate-term traders may start with the same patterns and initial stop as swing traders, but will generally hold as long as the overall market conditions remain favorable. Here we will focus on markets amenable to swing trading and swing trading setups. There are three keys to improving swing trading results:
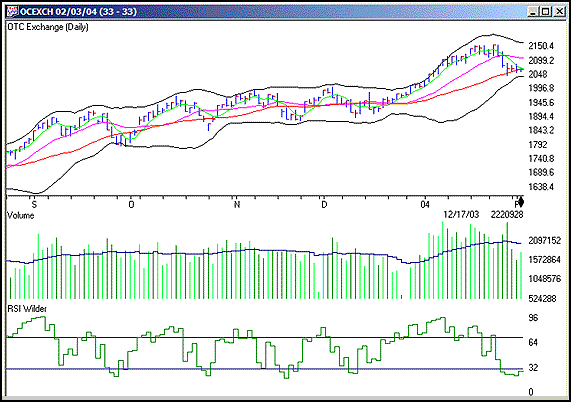
Analyzing market conditionsEvery evening, prior to running any scans, I spend time analyzing current market conditions. I am looking for support and resistance levels as well as determining if short-term, swing, or intermediate-term trading techniques are best suited to the current conditions. Trading without first analyzing the current market conditions will likely give you a lot of practice at exercising stops. Typically, I focus on swing trading when the market is trading in a wide range. A narrow-range market doesn't provide enough room for swing trades to work, and a trending market is usually more favorable to intermediate-term trading. A wide range is defined in terms of both the number of days it typically takes to get from one end of the range to the other, and the number of points between the top and bottom of the range. If it typically takes less than four days for the market to move from one end of the range to the other, I will favor short-term trading over swing trading. It usually takes at least one day to discover that the market has bounced off support or resistance, which leaves at least three days of a favorable environment for the swing trade to work if the market is trading in a range at least four days wide. I also look at the number of points between the upper and lower boundaries of the range and the average number of points the market travels in a day. If the market is trading in a 100-point range and it typically moves about 20 points a day, then there is plenty of room for a swing trade to capture a move. If the market is trading in a 60-point range and typically moves about 20 points a day, then there is usually not enough room for swing trades to work. Figure 1 shows the Nasdaq during the latter part of 2003 and January 2004. The market was trading in a 100-point range during the fourth quarter of 2003, which is a good time to use swing trading strategies. The market had a nice run in August, then broke a trendline in mid-September, followed by the establishment of a lower low in late September. A trendline break and a lower low indicated that the run was over and the trader should look for either a basing period or a retracement. It also indicates it is time to back off intermediate-term trading and switch to short-term or swing trading techniques.
Figure 1: A long trading range. The Nasdaq market was trading in a 100-point range during the third quarter of 2003, which is a good time to apply swing trading strategies.
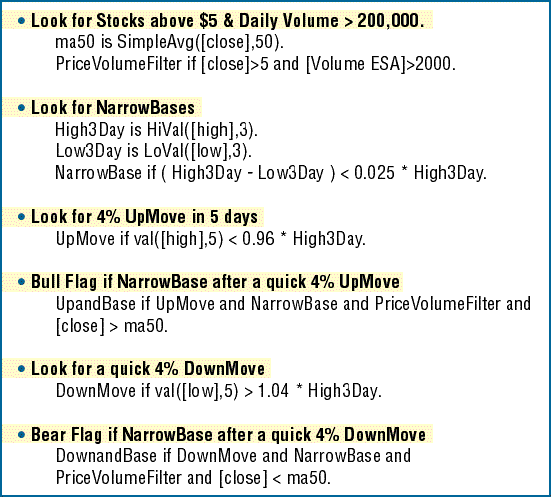
Have multiple scans to identify setupsThe setups I use most often for swing trading are pullbacks, trendline breaks, morning stars, and flags. It is important to have more than one type of scan in your toolbox, because sometimes the market will favor one type of setup over others. I like to have several tools available and go with the one that is working best. Figure 2 shows the Expert Design Studio (EDS) code for a scan I use to look for flags. A flag formation is a brief, narrow, basing area after a rapid runup in price. The first section in the flag scan of Figure 2 limits results to stocks above $5 with average volume of at least 200,000 shares a day. The second section looks for narrow basing periods. The third section looks for stocks that have made a move of at least 5% in five days. The fourth section combines these filters to look for potential bull flags.
Figure 2: EDS Scan for flag formations.
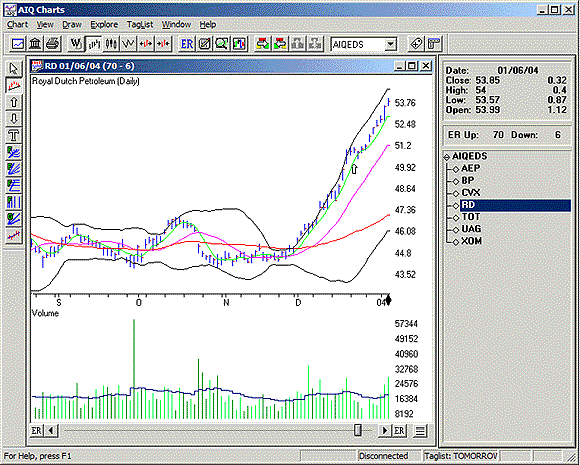
I ran the flag scan on December 22, 2003, and it found the seven candidates shown in Figure 3. Given the simple nature of the scan, I review the charts of each candidate looking for a rapid price move on strong volume, followed by lower volume during the basing period. Of the seven candidates found on December 22, 2003, four were interesting flag formations: RD, TOT, UAG, and XOM. Three days after finding the flag, RD broke out of the formation and had a nice three-day run, as shown in Figure 3.
Figure 3: Scan results. After running the scan, seven stocks were found to have flag formations. A few days after the flag formation in Royal Dutch Petroleum (RD), prices broke out of the formation and ran up nicely for a few days.
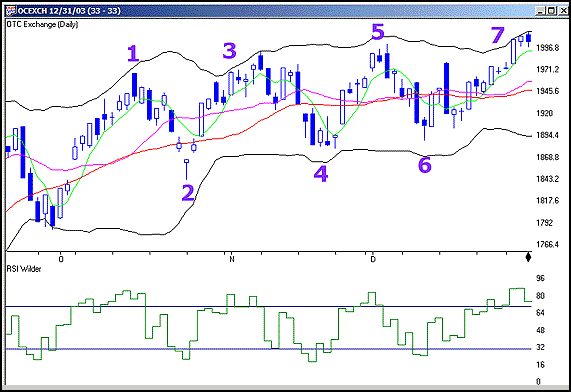
Trade with the marketFinding good swing trading setups is fairly straightforward. However, just taking every trade that comes along will lead to mixed results. The leverage in swing trading comes from learning to time the trades with the rhythm of the market. This requires learning to focus on the charts, not emotions or CNBC. When the market is trading in a base, the best time to take new swing trades on the long side is when the market bounces from the bottom of the base. New short trades should be taken when the market retraces from the top of the base. The middle of the base is the "no zone"; avoid new trades in this area and manage existing trades instead. Sometimes the top and bottom of a basing area are flat, making it easy to tell when the market is approaching support or resistance. Frequently, the top and bottom of the base slopes, which makes it a little harder to tell if the current swing has reached the upper or lower boundary of the base. In practice, it is often best to close positions as the market approaches support or resistance rather than trying to time the exact top or bottom. Figure 4 shows the Nasdaq in a three-month trading range. The island bottom at point 2 is an obvious place to start taking trades on the long side. Trades entered following the low at point 2, becoming profitable as the market bounces. As the market approaches the most recent swing high (point 1), I begin taking profits.
Figure 4: Swing trading in a range. Here's an example of how swing trading can be advantageous when prices are in a trading range. A previous swing high usually provides resistance, and the market usually does not move through resistance on the first try. This is why I begin taking profits as the market approaches the previous swing high. In the case of Figure 4, the market exceeds the high of point 1 for two days. During this period, I am out of the market looking for signs of a reversal, which would provide an opportunity to take new swing trades on the short side. The overbought nature of the four-day J. Welles Wilder relative strength index (RSI) shown on the bottom of Figure 4 gives me confidence that the market will reverse in the area of the previous swing high, so I begin looking for a lower low as an indication that a retracement has started. When the lower low occurs a few days after point 3, I take swing trades on the short side and begin looking for the market to test the support of the recent swing low, and signs of the market being oversold. As the market tests support at the bottom of the gap up from point 2 while the four-day RSI is showing an oversold condition, I take profits and start looking for a bounce to provide an opportunity to enter new Long positions. After testing the top of the gap from point 2 on four consecutive days (point 4), the market makes a higher high, which signals me to enter new swing trades on the long side and begin looking for a retest of the swing high at point 3, or an overbought condition. I keep repeating this process until the market breaks out of the basing area after point 7. I am often asked why I take profits when the market is approaching resistance rather than holding positions to see if the market can break through resistance. The reason is that markets usually do not break through resistance on the first try, and no one goes broke taking profits. When the market finally does break through resistance or support (as it always does), I will establish new trades in the direction of the market.
ConclusionSwing trading is a powerful tool that should be part of the trader's toolbox. As with most projects, the best results are obtained when an experienced user has the right tool for the job. If you would like to see my current market analysis and selected trading setups, email me at letter@daisydogger.com. If you would like to experiment with the scan discussed, email author at scan@daisydogger.com and I will send you the EDS file.
Steve Palmquist is a full-time swing trader with nearly 20 years of market experience. He is also the founder of www.daisydogger.com, which provides free market analysis, trading tips, and educational material including the Timely Trades Letter. Palmquist has taught trading strategies in seminars and at the Traders Expo. Current and past articles from Working Money, The Investors' Magazine, can be found at Working-Money.com. |
| Website: | www.daisydogger.com |
PRINT THIS ARTICLE

Request Information From Our Sponsors
- StockCharts.com, Inc.
- Candle Patterns
- Candlestick Charting Explained
- Intermarket Technical Analysis
- John Murphy on Chart Analysis
- John Murphy's Chart Pattern Recognition
- John Murphy's Market Message
- MurphyExplainsMarketAnalysis-Intermarket Analysis
- MurphyExplainsMarketAnalysis-Visual Analysis
- StockCharts.com
- Technical Analysis of the Financial Markets
- The Visual Investor
- VectorVest, Inc.
- Executive Premier Workshop
- One-Day Options Course
- OptionsPro
- Retirement Income Workshop
- Sure-Fire Trading Systems (VectorVest, Inc.)
- Trading as a Business Workshop
- VectorVest 7 EOD
- VectorVest 7 RealTime/IntraDay
- VectorVest AutoTester
- VectorVest Educational Services
- VectorVest OnLine
- VectorVest Options Analyzer
- VectorVest ProGraphics v6.0
- VectorVest ProTrader 7
- VectorVest RealTime Derby Tool
- VectorVest Simulator
- VectorVest Variator
- VectorVest Watchdog


