

HOT TOPICS LIST
- Strategies
- Stocks
- Buy
- Investing
- Brokers
- Psychology
- Interviews
- Accumulate
- Sell
- Hold
- Spotlight
- Websites
- Candlestick Corner
- Gold & Metals
- Options Trading
LIST OF TOPICS
TRADER'S NOTEBOOK
Oil Service Stocks Play Catch-up
11/03/04 04:28:52 PM PSTby Arthur Hill
Oil stocks are outperforming the broader market.
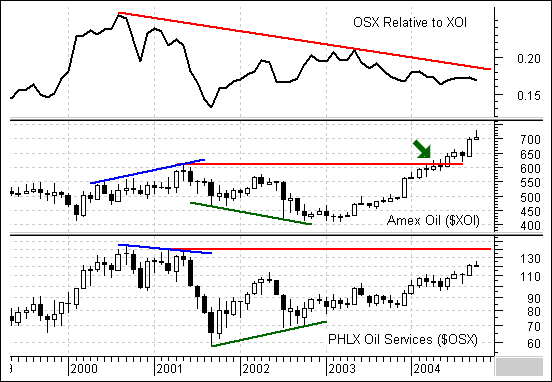
| It's no secret that oil-related stocks have been outperforming the broader market. Within this group, the Amex Oil Index ($XOI) has been outperforming the Philadelphia Oil Services Index ($OSX) (see Figure 1). The $XOI represents oil industry corporations, whereas the $OSX represents companies involved in oil drilling and production, oil service equipment, and reservoir services. The outperformance of the $XOI may be because investors are unsure of the sustainability of high oil prices. However, a prolonged period of higher oil prices is likely to translate into increased demand for oil services. This in turn will likely translate into higher share prices and potential outperformance by OSX in the future.
Figure 1: The Amex Oil Index ($XOI) and Philadelphia Oil Services Index ($OSX). Note that the $XOI has been outperforming the $OSX.
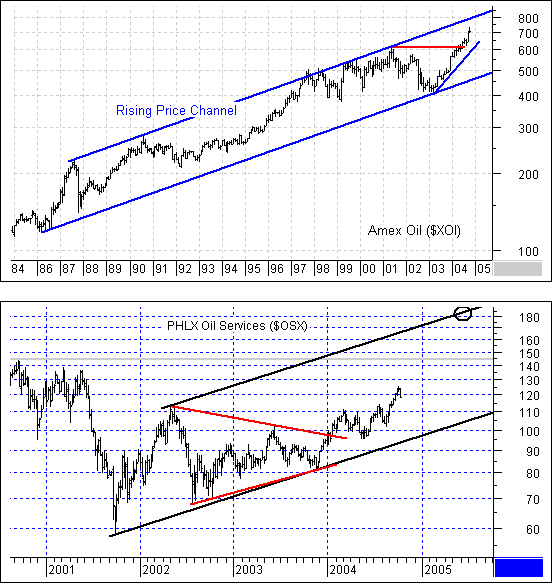
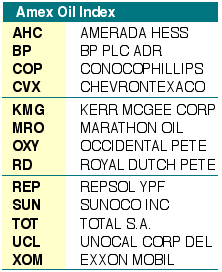
Since March 2003, the Amex Oil Index ($XOI) advanced from the low 400s to the low 700s. In the process, the index exceeded its 2001 high and is trading at a 20-year high. The major integrated oil companies led this index higher and include Amerada Hess (AHC), ChevronTexaco (CVX), ConocoPhillips (COP) and ExxonMobil (XOM) (see Figure 2).
Figure 2: Major oil companies in the $XOI
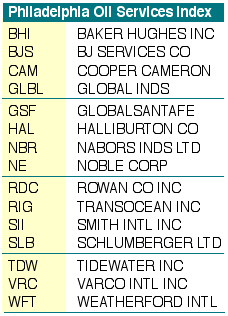
The Philadelphia Oil Services Index ($OSX) has also had a stellar run over the last two years. The index managed to exceed its 2002 high and has doubled since the September 2001 low, but remains below its 2001 highs and has underperformed XOI based on the chart. Key components of this index include Baker Hughes (BHI), Halliburton (HAL), Schlumberger (SLB), and Transocean (RIG) (see Figure 3).
Figure 3: Key Components of the $OSX
Past relationshipsA quick look at the five-year charts for the Oil Services Index ($OSX) and Oil Index ($XOI) reveals some interesting information (Figure 4). First of all, OSX formed a lower high in 2001, while XOI moved above its 2000 high (blue lines). This negative divergence or nonconfirmation by OSX preceded weakness in 2001 and 2002. Second, OSX formed a higher low in 2002 and XOI formed a lower low (green lines). This positive divergence or nonconfirmation by OSX preceded the big advance in 2003 and 2004. This five-year pattern suggests that OSX leads XOI, and a peak in XOI is unlikely until there is a negative divergence with OSX.
Figure 4: Negative and positive divergences. Patterns over the last five years suggest that the OSX leads the XOI.
Looking ahead to 2005There is further room to run for the $XOI, but the index is likely to meet resistance around 800 in 2005. Because the index recently moved to new highs and remains in such a strong uptrend, it was necessary to extend the lookback period for analysis (greater than 20 years). There is a larger rising price channel extending up from 1986. With the breakout above 600, the upside projection is toward the upper trendline (about 800) and the index will likely consolidate its gains in this area. This implies a 100-point advance (about 15%) from current levels. The $OSX also shows further room to run with the first upside target around 140-150 and the second upside target around 180-190. The index formed a large triangle in 2001 and 2002 (magenta lines). The trendline breakout in 2004 is bullish and the advance is projected to the next resistance level around 145, which is marked by the 2001 high (red line). A bit of consolidation can be expected around the 2001 highs and then a continuation toward the second target around 180-190. This second projection is based on a price channel evolving. The lower trendline was drawn first and the upper (parallel) trendline extends to around 180 by the middle of 2005.
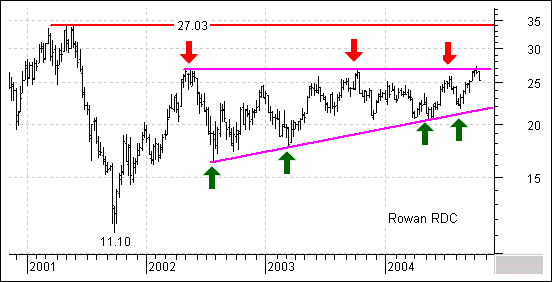
Individual stocksWith the Oil Services Index ($OSX) showing more promise than the Oil Index ($XOI) over the next few months, it makes sense to focus on the oil services stocks for future investments instead of oil industry corporations. A peruse through the 15 components reveals three stocks in consolidation patterns. Should these consolidations evolve into breakouts, significant upside moves should ensue for Rowan Cos., Tidewater, and Cooper Cameron. Rowan Companies (RDC) sports a bullish continuation pattern and looks poised for a breakout (Figure 5). After an advance from 11.10 to 27.06 (September 2001 to March 2002), the stock went into a long consolidation phase with higher lows (green arrows) and equal highs (red arrows). The higher lows show buying pressure at higher and higher prices as each low is above the prior. The equal highs show overhead supply around 27 and demand must overcome this supply. A breakout would signal victory and open the door to the mid-30s or a test of the 2001 high.
Figure 5: Stocks that are breaking out. If prices were to break out, then it is likely that prices could hit the 2001 high.
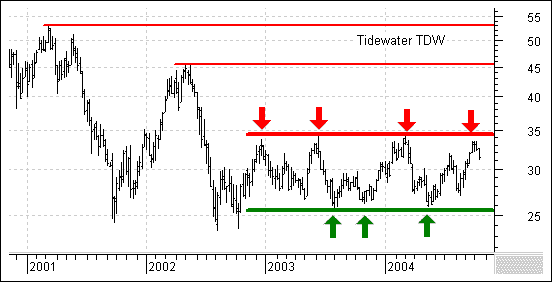
Tidewater (TDW) has been consolidating for more than two years and an upside breakout would open the door to a 52-week high (Figure 6). The stock formed a large rectangle with support around 25 and resistance around 35. There have been four bounces off resistance (supply line) and three bounces off support (demand line). A break above 35 would forge a 52-week high and open the door to the 2002 and 2001 highs.
Figure 6: Tidewater (TDW). This stock is currently consolidating within a triangle. Once prices break out above the resistance level at 35, prices could move as high as the 2002 and 2001 highs.
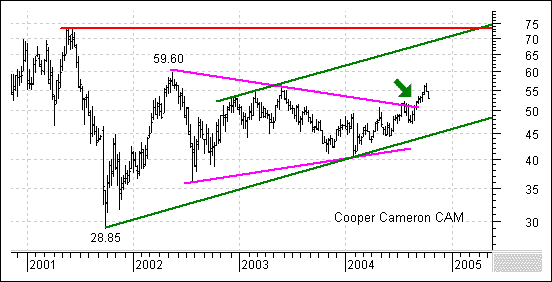
Cooper Cameron (CAM) recently broke triangle resistance and appears set to continue the advance that began in 2001 (Figure 7). There was a sharp move from about 30 to about 60 (September 2001 to May 2002) and then a long consolidation from May 2002 to March 2004. The breakout signals an end of the consolidation and a resumption of the prior move. There is some resistance around 55 and 60 from the prior highs, but the upside target is above 70 and expected in mid-2005. This target is based on the 2001 high as well as the upper trendline extension of a rising price channel.
Figure 7: Cooper Cameron (CAM). This stock has broken out of a triangle formation and has the potential to hit the mid-70s.
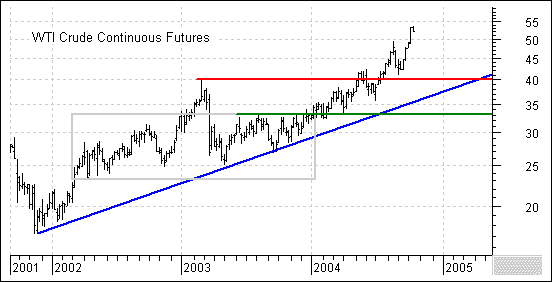
Key into oilThe bull market in oil shows no signs of letting up (Figure 8). The recent leg up in crude began in November 2001, and there was a large consolidation from March 2002 to December 2003 (gray rectangle). The consolidation breakout preceded the break above 40 and oil has remained above 40 for a few months. Even if oil fails to hold above 50, there appears to be plenty of support between 35 and 40 to keep prices high for quite some time.
Figure 8: NO SIGNS OF LETTING UP. Looks like the crude continuous contracts will remain high for a while. High oil prices represent an immediate benefit to the integrated oil companies in the Oil Index ($XOI). Revenues increase with the rise in prices, and profits soon follow. Some components within OSX are trading step-for-step with the leaders of XOI, and these companies are likely to continue higher should oil prices remain high. Sustained high oil prices also means that money will trickle down to those OSX components that haven't performed as well. This would likely be in the form of new investments and expanded drilling activities. This means that the laggards will play a game of catch-up and that game will begin with the key resistance breakouts outlined above.
Currently editor of TDTrader.com, a website specializing in trading strategies, Arthur Hill is a full member of the Society of Technical Analysts (STA London) and teaches the Momentum module for the STA diploma exam. He may be reached at arthurh@tdtrader.com. Current and past articles from Working Money, The Investors' Magazine, can be found at Working-Money.com. |
Arthur Hill is currently editor and publisher of TDTrader.com, a website specializing in trading strategies, sector/industry specific breadth stats and overall technical analysis. He is a full member of the Society of Technical Analysts (STA London) and teaches the Momentum module for the STA diploma exam. Prior to TD Trader, Arthur worked for Stockcharts.com and wrote much of the site's education center.
| Title: | Editor/Publisher |
| Company: | TDTrader.com |
| Website: | www.tdtrader.com |
| E-mail address: | arthurh@tdtrader.com |
Traders' Resource Links | |
PRINT THIS ARTICLE

Request Information From Our Sponsors
- StockCharts.com, Inc.
- Candle Patterns
- Candlestick Charting Explained
- Intermarket Technical Analysis
- John Murphy on Chart Analysis
- John Murphy's Chart Pattern Recognition
- John Murphy's Market Message
- MurphyExplainsMarketAnalysis-Intermarket Analysis
- MurphyExplainsMarketAnalysis-Visual Analysis
- StockCharts.com
- Technical Analysis of the Financial Markets
- The Visual Investor
- VectorVest, Inc.
- Executive Premier Workshop
- One-Day Options Course
- OptionsPro
- Retirement Income Workshop
- Sure-Fire Trading Systems (VectorVest, Inc.)
- Trading as a Business Workshop
- VectorVest 7 EOD
- VectorVest 7 RealTime/IntraDay
- VectorVest AutoTester
- VectorVest Educational Services
- VectorVest OnLine
- VectorVest Options Analyzer
- VectorVest ProGraphics v6.0
- VectorVest ProTrader 7
- VectorVest RealTime Derby Tool
- VectorVest Simulator
- VectorVest Variator
- VectorVest Watchdog