HOT TOPICS LIST
- Strategies
- Stocks
- Buy
- Investing
- Brokers
- Psychology
- Interviews
- Accumulate
- Sell
- Hold
- Spotlight
- Websites
- Candlestick Corner
- Gold & Metals
- Options Trading
LIST OF TOPICS
STRATEGIES
Finding Tradable Stocks
11/10/04 05:57:01 PM PSTby Jacob Singer
Here's a strategy that can give you a clue about what stocks to trade.
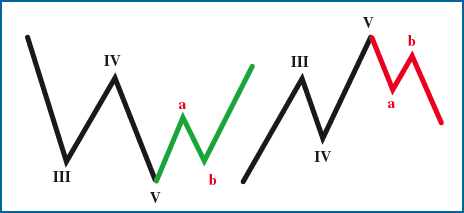
| As traders, we are always trying to find the utmost perfect strategy for stock market trading, the so-called Holy Grail -- the one that will always give you a sure winner. Does it exist? I don't know, but here's a strategy that looks promising. Check it out, tweak it to fit your needs, and decide for yourself. First of all, the patterns for a buy signal and for a future short (Figures 1A and 1B) look pretty straightforward.
FIGURE 1: Here's a buy signal and a future short, respectively.
But if you take a close look, you have to wonder is that right? Shouldn't it be the other way around? The buy is a falling or short pattern and the short is a rising or buy pattern isn't it? Actually, the two patterns and the way I have described them are the basis for a number of final patterns. Consider Figure 2. The pattern is the fourth and fifth wave of an Elliott wave pattern, which shows a change of direction.
FIGURE 2: Here are the fourth and fifth waves of the classic Elliott wave pattern.
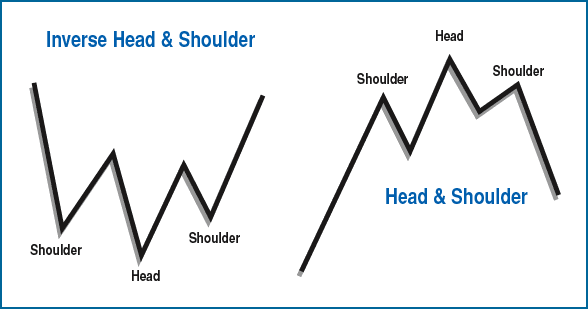
The pattern is also the start of the familiar head-and-shoulder, a pattern that is excellent for determining a target (Figure 3).
FIGURE 3: Inverse head-and-shoulder and the head-and-shoulder right way up.
It is also a pattern that could break a short-term trendline, moving average, or any other trend-following indicator you may prefer using. Okay, so how do we use it to forecast a market? Look at Figure 4, which should give you an idea.
FIGURE 4: Higher highs vs. lower lows.
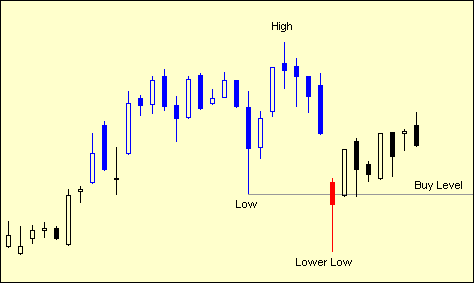
"You have a point," you may say. "This way, it does look interesting. But how would I develop a strategy to trade these patterns?" Glad you asked. Listed in Figure 5 is a strategy that I developed and tested in real time. I am quite pleased with the results. The first thing to do is identify the pattern. This is easy, and you can program a formula to highlight a number of shares to look at. Eyeballing these shares will eliminate half of them, but the few remaining are the ones to analyze. Having chosen the shares with patterns that fit the strategy, you must decide when to buy or sell. The share price forms a low (high), then a lower low (higher high), and then starts retracing. At what point do you place your order?
FIGURE 5: A break above a Fibonacci level of the range between the high after the low, and the lower low.
FIGURE 6: A break above the previous low.
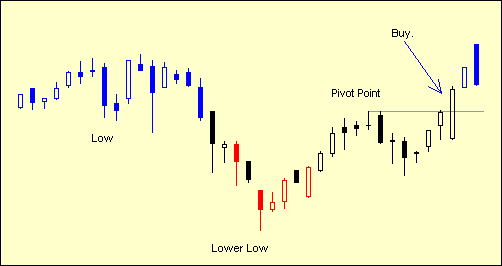
You could also wait for a retracement and buy the share when it rises above the pivot point, as shown in Figure 7.
FIGURE 7: Waiting for a retracement.
But whatever strategy you decide to use, intraday, daily, or weekly, the system can produce surprisingly good results. To find out exactly how the strategy worked, I ran a test portfolio from December 30, 2003 (Figure 8).
FIGURE 8: Here's a test portfolio.
Even though the market fell from March 2004, the portfolio is still in profit. I placed an 8% stop-loss on all stocks, but only one sell signal was given, and that was on HIP Technology on the Toronto Stock Market (HP-T). To identify stocks that could be possible buys, I programmed Technifilter Plus as outlined in the sidebar. I included volume in my formula, as I look for falling volume as the price falls. This is a sign of strength, as is rising volume with price rises. I have found that the strategy gives better results when you trade the share chosen with a 4% stop-loss. You may be in the share for as long as four to five days, depending on which day of the week you enter the market. It may not be the Holy Grail, but it can still be useful for you.
Jacob Singer has been a technical analyst since 1969. He has worked as a futures and options trader, a technician specializing in gold and gold shares, and editor of a South African tipping sheet before emigrating to Canada, qualifying as an investment advisor. He has developed and uses a mutual fund investment strategy for client portfolios called MOM Investing. He may be reached at jsinger@globalsec.com.
Charts courtesy TechniFilter Plus
Current and past articles from Working Money, The Investors' Magazine, can be found at Working-Money.com. | |||||||||||||||||||||||||||||||||||||||||||||||||||||||||||||||||||||
Sidebar TECHNIFILTER PLUS FORMULA NAME: 20-Day Lower Low + Volume DESCRIPTION: We have a 20-day low, and then four days later, a lower low. Today's close must be greater than the 20-day low to be a buy. Note: I look back at 20 days only, but this can be increased depending on your strategy. For the lower low, I look back four days, because I want to make sure that the lower low has been established. FORMULAS
FILTERS
| |||||||||||||||||||||||||||||||||||||||||||||||||||||||||||||||||||||
Has been a Technical analyst since 1969 and was a member of the Market Technicians Association of America. Worked as a Futures and Options Trader with First Financial Futures in Johannesburg, South Africa for three years, then for Irish Menell Rosenberg, stock brokers in their research department as a Technician specializing in Gold and Gold shares. He was the Editor of a popular South African tipping sheet, Temkin and Moon, till 1992, and emigrated to Canada qualifying as an Investment advisor. Jack has developed and uses a very successful Mutual Fund investment strategy for client portfolios, called MOM Investing. The strategy is available on a weekly updated web page, restricted to clients only.
| Company: | Global Securities Corporation |
| Address: | Three Bentall Centre, 595 Burrard Street |
| Vancouver, BC V7X 1C4 | |
| Phone # for sales: | 604 443 5473 |
| Fax: | 604 689 5401 |
| Website: | regpub.homestead.com/index.html |
| E-mail address: | jsinger@globalsec.com |
Traders' Resource Links | |
PRINT THIS ARTICLE

|

Request Information From Our Sponsors
- StockCharts.com, Inc.
- Candle Patterns
- Candlestick Charting Explained
- Intermarket Technical Analysis
- John Murphy on Chart Analysis
- John Murphy's Chart Pattern Recognition
- John Murphy's Market Message
- MurphyExplainsMarketAnalysis-Intermarket Analysis
- MurphyExplainsMarketAnalysis-Visual Analysis
- StockCharts.com
- Technical Analysis of the Financial Markets
- The Visual Investor
- VectorVest, Inc.
- Executive Premier Workshop
- One-Day Options Course
- OptionsPro
- Retirement Income Workshop
- Sure-Fire Trading Systems (VectorVest, Inc.)
- Trading as a Business Workshop
- VectorVest 7 EOD
- VectorVest 7 RealTime/IntraDay
- VectorVest AutoTester
- VectorVest Educational Services
- VectorVest OnLine
- VectorVest Options Analyzer
- VectorVest ProGraphics v6.0
- VectorVest ProTrader 7
- VectorVest RealTime Derby Tool
- VectorVest Simulator
- VectorVest Variator
- VectorVest Watchdog

