HOT TOPICS LIST
- Strategies
- Stocks
- Buy
- Investing
- Brokers
- Psychology
- Interviews
- Accumulate
- Sell
- Hold
- Spotlight
- Websites
- Candlestick Corner
- Gold & Metals
- Options Trading
LIST OF TOPICS
THE CHARTIST
Reading The QQQs With Elliott Waves
11/23/04 03:31:52 PM PSTby Jacob Singer
Elliott waves can be misleading. What seems to be an obvious wave count can change in the blink of an eye.
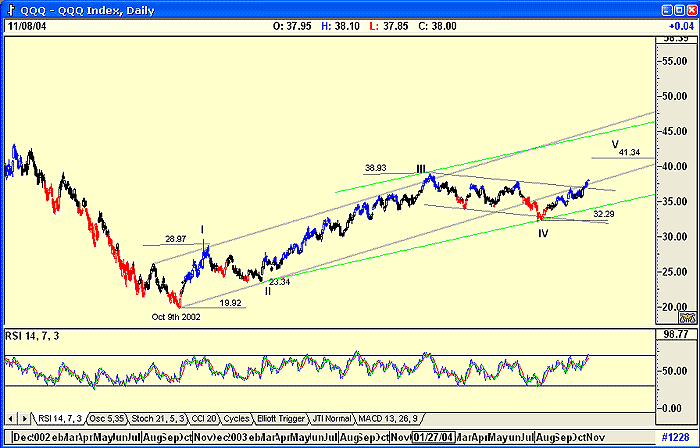
| Elliott waves can be misleading. In all the years I have used them, I have always found that I should have an alternate count in my back pocket, because what once seemed like an obvious wave count can change in the blink of an eye. Here's an example: Figure 1 is a daily chart of the QQQs. The wave count looks simple enough, with the five-wave count starting on October 9, 2002. The ratios between the waves, although not perfect, were close enough to be acceptable. These ratios can be found in Figure 2.
Figure 1: Daily chart of the QQQs
Figure 2: Elliott wave ratios
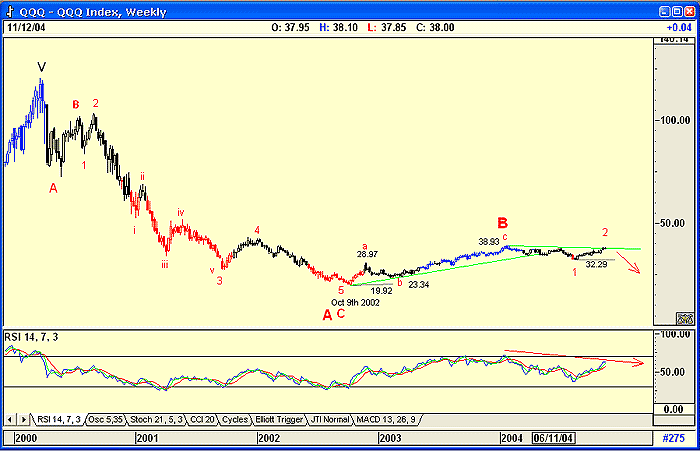
Wave 1 moved from 19.92 to 28.97 = 9.05. Wave 2 is usually a Fibonacci retracement of wave 1. In this chart, it moved from 28.97 to 23.34, a retracement of 62.21%, acceptably close to the Fibonacci ratio of 61.8%. Wave 3 should be a Fibonacci ratio of wave 1. Wave 3 must be equal to or greater than wave 1. In this chart, wave 3 is equal to 172.27% of wave 1, close enough to 161.8% to be acceptable. There are occasions where wave 3 is smaller in magnitude than wave 1. When this occurs, wave 5 will be smaller than wave 3. Wave 5 is usually equal to or greater than wave 1. If it is smaller than wave 1, then its move is considered a failure, and the ABC bear market move that follows could also be constricted. In Figure 1, note that wave 4 was far more complicated than wave 2, which is correct in Elliott terms. If wave 2 is simple wave, then wave 4 must be a complicated wave, and vice versa. The projected target for the top of wave 5 is 41.34 (32.29 + wave 1 of 9.05). But is this a true count? The trendlines don't agree with the count. I prefer to see trendlines strengthening as the price moves up. The fact that the green support line is below the gray support line suggests that wave 5 could be a failure, or even that the entire count is incorrect. Because of this, I must now look at the weekly chart (Figure 3), which suggests a completely different wave count.
Figure 3: Weekly chart of the QQQs
The chart suggests that the QQQs have completed wave 1 of major wave C down. They are now tracing wave 2 of wave C, and a turndown into wave 3 of wave C could occur at any time. Of course, should the QQQs break decisively above $38.93, then the daily count will verify itself, and I would have to change the weekly count accordingly. What I have shown as wave A, with waves B and C to follow, would in a revised count suggest that the rise could be the start of a major bull market, and that the chart is in the process of completing wave v of wave 1 upward. I have shown this possible count in green on the chart. With either count, a strong bear retracement will follow, but with the alternate count (green), wave 2 could be a 72% retracement of the rise of wave 1. This means that we could see a retest close to the 19.92 level, enough to turn many bulls into bears. The relative strength index (RSI) indicator on the weekly chart is suggesting that the trend is down, but on the daily chart, the indicator is suggesting strength, so the conflict persists even further. To sum up, Elliott waves act like signposts in the wilderness: They tell you where the market could be and where it could be going. However, we have to keep an open mind and be prepared to change our point of view at the drop of a hat. The QQQs represent the Nasdaq, and I am beginning to believe that the Nasdaq has entered a new bullish phase, but as the weekly chart of the QQQs suggests, I could be wrong.
Jacob Singer has been a technical analyst since 1969. He may be reached via email at jsinger@globalsec.com.
Current and past articles from Working Money, The Investor's Magazine, can be found at Working-Money.com. |
Has been a Technical analyst since 1969 and was a member of the Market Technicians Association of America. Worked as a Futures and Options Trader with First Financial Futures in Johannesburg, South Africa for three years, then for Irish Menell Rosenberg, stock brokers in their research department as a Technician specializing in Gold and Gold shares. He was the Editor of a popular South African tipping sheet, Temkin and Moon, till 1992, and emigrated to Canada qualifying as an Investment advisor. Jack has developed and uses a very successful Mutual Fund investment strategy for client portfolios, called MOM Investing. The strategy is available on a weekly updated web page, restricted to clients only.
| Company: | Global Securities Corporation |
| Address: | Three Bentall Centre, 595 Burrard Street |
| Vancouver, BC V7X 1C4 | |
| Phone # for sales: | 604 443 5473 |
| Fax: | 604 689 5401 |
| Website: | regpub.homestead.com/index.html |
| E-mail address: | jsinger@globalsec.com |
Traders' Resource Links | |
PRINT THIS ARTICLE

Request Information From Our Sponsors
- StockCharts.com, Inc.
- Candle Patterns
- Candlestick Charting Explained
- Intermarket Technical Analysis
- John Murphy on Chart Analysis
- John Murphy's Chart Pattern Recognition
- John Murphy's Market Message
- MurphyExplainsMarketAnalysis-Intermarket Analysis
- MurphyExplainsMarketAnalysis-Visual Analysis
- StockCharts.com
- Technical Analysis of the Financial Markets
- The Visual Investor
- VectorVest, Inc.
- Executive Premier Workshop
- One-Day Options Course
- OptionsPro
- Retirement Income Workshop
- Sure-Fire Trading Systems (VectorVest, Inc.)
- Trading as a Business Workshop
- VectorVest 7 EOD
- VectorVest 7 RealTime/IntraDay
- VectorVest AutoTester
- VectorVest Educational Services
- VectorVest OnLine
- VectorVest Options Analyzer
- VectorVest ProGraphics v6.0
- VectorVest ProTrader 7
- VectorVest RealTime Derby Tool
- VectorVest Simulator
- VectorVest Variator
- VectorVest Watchdog


