HOT TOPICS LIST
- Strategies
- Stocks
- Buy
- Investing
- Brokers
- Psychology
- Interviews
- Accumulate
- Sell
- Hold
- Spotlight
- Websites
- Candlestick Corner
- Gold & Metals
- Options Trading
LIST OF TOPICS
TRADER'S NOTEBOOK
What Are Insiders Telling Us?
12/01/04 02:16:04 PM PSTby Matt Blackman
What corporate insiders do in the stock market can tell us a lot about where they believe the market is going. When corporate executives are buying their company's stock in greater than average amounts, it often means a market bottom of sorts. When they are selling like never before, it can warn of a market top. Lately insider buying has been flat but then so has selling. What does it mean?
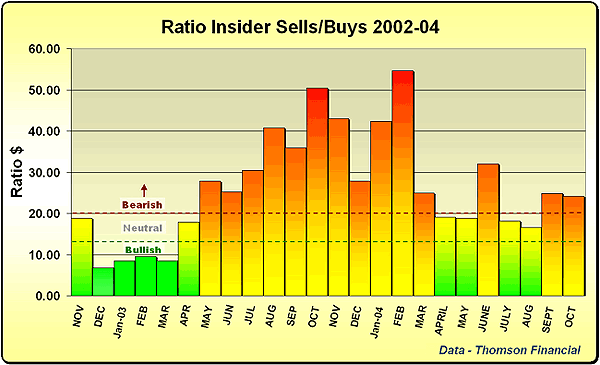
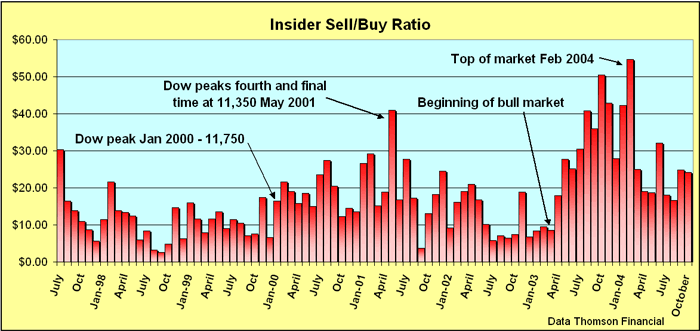
| Insider buying and selling tend to provide useful buy and sell signals for the rest of us to follow when used in conjunction with trend analysis and general market sentiment. Insider buying (as demonstrated by a low sell/buy ratio see Figures 1 and 2) tends to be a very good buy signal near market bottoms or in bull markets and a high ratio value, a good selling signal near market tops and in bear markets. Easy to identify in hindsight, identifying tops and bottoms is a far greater challenge while they are unfolding. According to the November 2004 client advisory from Thomson Financial, buying by corporate insiders remained flat in October compared to September with just $101 million of shares purchased in their own companies. Buying activity fell well short of the 5-year monthly average of $160 million. Meanwhile, the same was true for insider selling. A total of $2.5 billion worth of shares were sold by corporate insiders, which equaled September's sales.
Figure 1: The insider sell/buy ratio from November 2002 to October 2004. In October, the ratio was $24.23. A ratio value of $20 or more is considered bearish and $12 or below, bullish "although over the past year this signal has been less predictive in light of the market's performance," according to the November 3 Thomson Financial advisory. Data by http://www.thomson.com/
Thomson Financial broke down the buying and selling in October as follows:
1)On a sector basis, finance and healthcare continue to experience some of the strongest insider buying activity. 2)Small cap (companies with market caps below $1 billion) witnessed 82% of the total executive buying in October, the largest level in more than a year, while large caps (companies with market cap greater than $5 billion) experienced just 3% of the total buying by insiders for the lowest level in more than a year. Large cap insider selling represented 51% of the total, which was the highest level since January 1999. 3)Technology stocks experienced a bearish increase in insider selling in October followed closely by strong selling in business sector companies. It is interesting to note that according to John Murphy in his book, Technical Analysis of the Financial Markets, large caps traditionally do well in a weak U.S. dollar environment since this makes their products more affordable in overseas markets. Small caps, which are generally stronger domestically, usually benefit from a strong dollar. As we see above, however, just the opposite has been occurring as the U.S. dollar continued to weaken. In a telephone conversation with Mr. Murphy on November 8, he mentioned that the above relationship is generally true in mature or declining markets but he believes that we are in a recovery phase in which small caps lead large caps. The fact that small caps are outperforming bodes well for the economy and stock markets longer-term. This relationship is discussed in greater detail in his most recent book, Intermarket Analysis Profiting from Global Market Relationships. The book is a must-read for traders and longer-term investors alike.
Figure 2 Insider sell/buy ratio July 1997 to October 2004 showing insider activity in relation to market tops and bottoms. Data by http://www.thomsonfinancial.com
Insider activity on the other hand, tends to be a shorter-term indicator. Insider trading expert and author of a newly released book on the subject entitled The Vital Few versus the Trivial Many: Invest with the Insiders, Not the Masses, George Muzea had this to say in an email response to my question, "Given where we are in a recovery phase in the economic cycle and the fact that October often represents good seasonal buying opportunities, how do you interpret the low volume of buying by corporate insiders?"
"Insider buying did not surface in October, something I have rarely seen in the fourth quarter into a depressed stock market. However, October insider sales were normal and below previous market top ranges. Most insiders are value investors and are impervious to geopolitical events and current economic trends. They are solely concerned about the price of their stock versus what they perceive to be their companies' intrinsic value. The lower the stock price drops, the more they buy, which is why insider buying is so aggressive at market bottoms." "The current lack of insider buying must be attributed to their overall belief that most stocks are not at value points. The subdued selling could be a sign that insiders sold enough stock earlier this year and are in a waiting mode for more value. This action supports a trading range market. Insider selling after the election has increased, a sign that if the market gains persist through the end of the month, we most likely will be at market top levels."
"Current insider attitudes support a trading range market, one that is most likely closer to the top of that range. In my opinion, to achieve consistent performance over the next six months, one needs to be selective in buying stocks and sectors. Both Tax Loss Buy Model Portfolios are up sharply. To be uniform with past years, I will close out these portfolios when insider-selling approaches market top ranges. Money managers should consider taking profits in technically extended positions." The Thomson Financial Insider Research team made a revealing comment in their most recent advisory: "Historically, a reading above $20 has indicated bearish sentiment, although over the past year this signal has been less predictive in light of the market's performance."
But as we see from Figure 2, insider activity has been a good predictive indicator since 1997. While insiders were not selling in great numbers at the Dow market top (11,750) in January 2000, after hitting its fourth and final peak (11,350), the Dow began to drop in the month that insider selling hit a peak. Insiders buying began in July 2002 (as demonstrated by a very low sell/buy ratio) and continued through March of 2003, which coincided with the beginning of the latest bull market. Selling also hit a high in February 2004 as the Dow hit its early 2004-year peak. Putting it all together, although we are currently in recovery phase in which small caps outperform large caps, insiders do not see this as an opportunity to buy stocks (other than small caps) just yet. But they are buying small caps in levels not seen for more than a year. Sectors that warrant special buying attention are finance and healthcare.
Matt Blackman is a technical trader, author, reviewer, keynote speaker and regular contributor to a number of trading publications and investment/trading websites in North America and Europe. Blackman is an affiliate Market Technicians Association and Canadian Society of Technical Analysts member and currently enrolled in the Chartered Market Technicians (CMT) program. He can be reached at matt@tradesystemguru.com Suggested reading Current and past articles from Working Money, The Investors' Magazine, can be found at Working-Money.com. |
Matt Blackman is a full-time technical and financial writer and trader. He produces corporate and financial newsletters, and assists clients in getting published in the mainstream media. He tweets about stocks he is watching at www.twitter.com/RatioTrade Matt has earned the Chartered Market Technician (CMT) designation.
| E-mail address: | indextradermb@gmail.com |
PRINT THIS ARTICLE

|

Request Information From Our Sponsors
- StockCharts.com, Inc.
- Candle Patterns
- Candlestick Charting Explained
- Intermarket Technical Analysis
- John Murphy on Chart Analysis
- John Murphy's Chart Pattern Recognition
- John Murphy's Market Message
- MurphyExplainsMarketAnalysis-Intermarket Analysis
- MurphyExplainsMarketAnalysis-Visual Analysis
- StockCharts.com
- Technical Analysis of the Financial Markets
- The Visual Investor
- VectorVest, Inc.
- Executive Premier Workshop
- One-Day Options Course
- OptionsPro
- Retirement Income Workshop
- Sure-Fire Trading Systems (VectorVest, Inc.)
- Trading as a Business Workshop
- VectorVest 7 EOD
- VectorVest 7 RealTime/IntraDay
- VectorVest AutoTester
- VectorVest Educational Services
- VectorVest OnLine
- VectorVest Options Analyzer
- VectorVest ProGraphics v6.0
- VectorVest ProTrader 7
- VectorVest RealTime Derby Tool
- VectorVest Simulator
- VectorVest Variator
- VectorVest Watchdog


