HOT TOPICS LIST
- Strategies
- Stocks
- Buy
- Investing
- Brokers
- Psychology
- Interviews
- Accumulate
- Sell
- Hold
- Spotlight
- Websites
- Candlestick Corner
- Gold & Metals
- Options Trading
LIST OF TOPICS
THE CHARTIST
S&P 500: Overbought, Maybe. Bearish, No
12/03/04 03:38:11 PM PSTby Arthur Hill
The Standard & Poor's 500 is poised to rise even farther.
| Indicators offer an objective and quantifiable means to identify securities that have moved to extremes. The stochastic oscillator, a popular momentum indicator, can easily be used to identify price extremes because it fluctuates between zero and 100. No matter how far or fast the price movement, the indicator cannot move below zero or above 100. Before moving further, let's briefly review the components of the stochastic oscillator: %K (with slowing) and %D. %K is the actual indicator that measures the current price relative to high-low range of the lookback period. The slowing of %K simply means that a short moving average was applied for smoothing. %D is a moving average of %K (with slowing) and acts as a trigger. I used a 20-day %K with a five-period slowing (black line) and a five-period moving average (magenta line).
The formula for calculating the stochastic oscillator is:
%k = 100 * ((Recent Close Lowest low (n)) / (Highest High(n) Lowest Low (n))
%d = n-period moving average of %k
n = no of periods
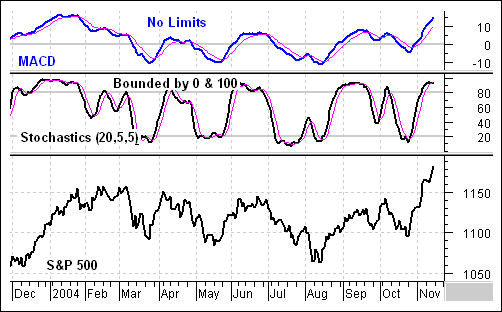
The stochastic oscillator is considered overbought when it exceeds 80. Since the oscillator cannot exceed 100, it is clearly near its upper reaches when trading above 80. The moving average convergence/divergence (MACD), which I have included in Figure 1, on the other hand, does not have such boundaries and can extend indefinitely. As such, it is not useful for identifying extreme levels.
Figure 1: S&P 500 and the MACD. Unlike the stochastic oscillator, the MACD is not useful for identifying extreme levels because it does not have boundaries.
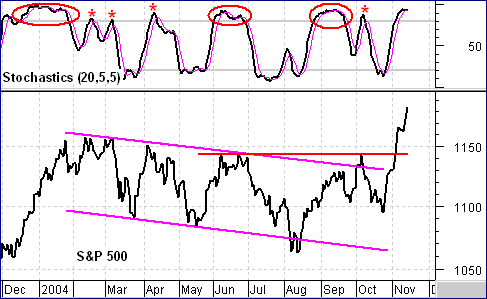
An overbought signal is not the same as a bearish signal. Securities in strong uptrends can become overbought and remain overbought as their advance extends. The initial move into overbought territory shows strength and should be considered bullish as long as the security remains overbought. Turning to the S&P 500, we can see that the index became overbought (above 80) no fewer than eight times this past year (Figure 2). The red asterisks show four overbought periods that lasted less than five days and the red ovals show three overbought periods that lasted 18 days or more. The index recently moved into overbought territory on November 4 and has been overbought for seven days now.
Figure 2: S&P 500 and stochastics. The index became overbought no fewer than eight times in the past year.
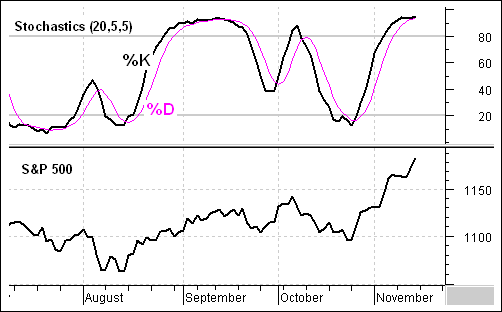
Even though the stochastic oscillator is overbought, it appears as though the early or middle stages of an overbought period with the Standard & Poor's 500 index is poised to rise even more.
Figure 3: S&P 500 and the stochastic oscillator. The stochastic oscillator is overbought, but it appears as though the S&P 500 is poised to continue to rise.
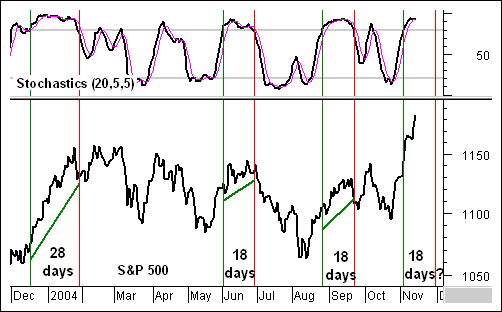
The bulls are on firm footing as long as the stochastic oscillator remains above 80. For the two 18-day overbought periods, the upside after becoming initially overbought was relatively small. However, it would have been premature to turn bearish on the initial cross above 80 (green line). When the indicator remained above 80 for 28 days in January, the upside after initially becoming overbought was quite impressive. The lesson here is that traders should at least respect upside strength as long as the stochastic oscillator holds above 80 (red lines).
Figure 4: S&P 500 and stochastics
With the stochastic oscillator above 80 for a week now, the S&P 500 shows strong buying pressure that is unlikely to disappear overnight. (Figure 4) Using the 2004 extremes as a guideline, the indicator could remain overbought for 18 to 28 days. Should the indicator remain overbought for a further 11 days (18 days total), we can expect a cross below 80 at the end of November. The early bird may get the worm, but the second mouse gets the cheese. Turning bearish while the indicator remains above 80 would be jumping the gun and put traders in the first mouse position, which has a greater risk of getting caught in trap. Until the stochastic oscillator actually moves below 80, the path of least resistance is up and traders should expect further strength in S&P 500. A move below 80 would signal an let-up in buying pressure and open the door to a pullback or even deeper decline.
Arthur Hill is currently editor of TDTrader.com, a website specializing in trading strategies, sector/industry specific breadth stats, and overall technical analysis. He is a member of the Society of Technical Analysts (STA London) and of IATF-ITFA Belgium. Prior to TDTrader, he was the chief technical analyst for StockCharts.com and the main contributor to the ChartSchool. TDTrader Current and past articles from Working Money, The Investors' Magazine, can be found at Working-Money.com. |
Arthur Hill is currently editor and publisher of TDTrader.com, a website specializing in trading strategies, sector/industry specific breadth stats and overall technical analysis. He is a full member of the Society of Technical Analysts (STA London) and teaches the Momentum module for the STA diploma exam. Prior to TD Trader, Arthur worked for Stockcharts.com and wrote much of the site's education center.
| Title: | Editor/Publisher |
| Company: | TDTrader.com |
| Website: | www.tdtrader.com |
| E-mail address: | arthurh@tdtrader.com |
Traders' Resource Links | |
PRINT THIS ARTICLE

Request Information From Our Sponsors
- StockCharts.com, Inc.
- Candle Patterns
- Candlestick Charting Explained
- Intermarket Technical Analysis
- John Murphy on Chart Analysis
- John Murphy's Chart Pattern Recognition
- John Murphy's Market Message
- MurphyExplainsMarketAnalysis-Intermarket Analysis
- MurphyExplainsMarketAnalysis-Visual Analysis
- StockCharts.com
- Technical Analysis of the Financial Markets
- The Visual Investor
- VectorVest, Inc.
- Executive Premier Workshop
- One-Day Options Course
- OptionsPro
- Retirement Income Workshop
- Sure-Fire Trading Systems (VectorVest, Inc.)
- Trading as a Business Workshop
- VectorVest 7 EOD
- VectorVest 7 RealTime/IntraDay
- VectorVest AutoTester
- VectorVest Educational Services
- VectorVest OnLine
- VectorVest Options Analyzer
- VectorVest ProGraphics v6.0
- VectorVest ProTrader 7
- VectorVest RealTime Derby Tool
- VectorVest Simulator
- VectorVest Variator
- VectorVest Watchdog


