HOT TOPICS LIST
- Strategies
- Stocks
- Buy
- Investing
- Brokers
- Psychology
- Interviews
- Accumulate
- Sell
- Hold
- Spotlight
- Websites
- Candlestick Corner
- Gold & Metals
- Options Trading
LIST OF TOPICS
THE CHARTIST
On Oil: Reversals, Candlesticks, And Gaps
12/15/04 03:16:21 PM PSTby Chris Manuell
Recent developments in the light crude oil price charts may give us a hint of what's to come.
| The oil market has recently completed a reliable and popular chart reversal pattern: the head & shoulders pattern (H&S). This pattern could mark the end of the recent long-term rally in light crude that began in late 1999. One of the important tenets of technical analysis is that a trend is assumed to be in effect until it provides definite signals that it has reversed. This supports the notion that there is a higher probability that the existing trend will remain in place.
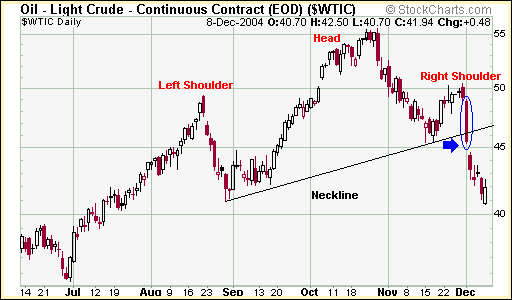
Head & shouldersThe head & shoulders pattern is a top reversal pattern; it provides a signal that the trend has reversed. The H&S reversal pattern on light crude is a textbook pattern that heightens the probability that the long-term rally may be complete (Figure 1).
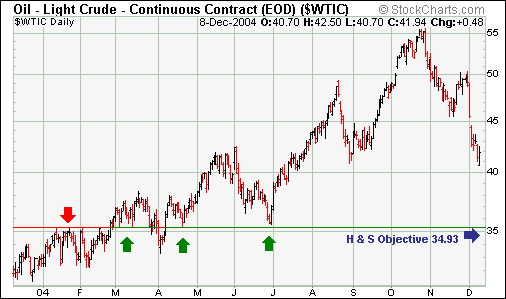
Figure 1: Head & shoulders reversal. A wide range day breaks beneath the steep neckline of this head & shoulders top in crude oil futures. The left shoulder was formed in the middle of August, as prices faltered below the 50 level and then endured a corrective dip. The market then resumed its long-term rally and proceeded to record fresh highs in October; this constituted the head of the pattern. Light crude then retraced sharply and moved below the August peak (left shoulder) before finding support on November 15 with a bullish hammer at 45.45. The subsequent bounce to the 50 region enabled a right shoulder to form. This shoulder is in the vicinity of the August peak and thus provides symmetry with the left shoulder. The market then retraced aggressively from the 50 region and made a strong directional statement with a decisive violation of the upward-sloping neckline on December 1. The close beneath the neckline completed the head & shoulders formation. Conservative traders could have waited for the two successive closes beneath the neckline before considering the pattern valid. The breach of the neckline was marked by heavy volume, with the NYMEX light crude oil January contract recording above-average volume sessions on December 1 and 2. This high volume validates the downside breakout from the head & shoulders reversal pattern. The completion of the head & shoulders pattern allows a price objective to be formed for light crude. As with many chart patterns, this target is calculated by taking the height of the pattern and then projecting that distance from the breakout point. The height of the light crude pattern can be calculated by taking the vertical distance from the head to the neckline. The highest high was formed at the head on October 27 at 55.65. The level of the neckline on October 27 was 44.30. The vertical distance is 11.35, which can be subtracted from the breakout point as determined by the rupturing of the neckline on December 1 at 46.28. This provides a minimum objective of 34.93. An important rule to remember that this is only a minimum objective and the price may indeed go beyond that level. Technicians, like pilots, need to adjust their techniques if conditions change. Price objectives based on price patterns are no exception. The objective should be adjusted if other technical signals emerge, such as a significant support or resistance level. The minimum objective may need to be adjusted for light crude as a significant support level emerges in the 35.2-5 region. This region represents the change of polarity principle — that is, old resistance becomes new support. This principle does not have to be applied to a specific point; it can also function within a range. Light crude had difficulty breaching this zone in early 2004 (Figure 2); it went on to provide subsequent support in April and June. Prudence would dictate that this point should overrule the minimum objective for the head & shoulders target, allowing for an upward adjustment to the 35.50 region.
Figure 2: Price objectives. Note how the minimum price objective for a breakdown from this head and shoulder top coincides with a region of great potential support near 35. The arrows show how this level has served as both resistance and support in the recent past.
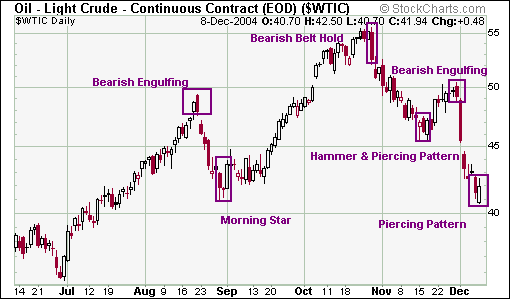
Oil be nimble, oil be quickA closer inspection of the head & shoulders pattern would enable a nimble, short-term candlestick trader to monitor the swings within the pattern with some dexterity. Figure 3 demonstrates that a candlestick pattern was present at each turning point of the pattern. The left shoulder was marked by a bearish engulfing pattern, which is a dual candlestick pattern with a second dark candle that "engulfs" the prior white candle. This pattern stalled the rally and resulted in a short-term correction. The move lower from the left shoulder was pulled up by a bullish morning star pattern. The morning star is made up of three candles: a dark candle with a long body, a small body or star, and a white candle with a long body that intrudes deeply into the body of the first candle.
Figure 3: Candlestick confirmations. Candlestick analysis can often help clarify or confirm chart patterns by signaling potential short- and intermediate-term turning points.
Light crude met these conditions in late August and subsequently rallied to new highs in October. The head of the formation on October 28 completed a bearish belt hold (a dark candle with a long body that opens near the high and closes on or near its low). This candle was also a reversal day in bar-charting parlance. First, a new high was made at 55.65, and then came a lower close than the previous session. In hindsight, this top reversal day provides the head & shoulders pattern with more significance. A hammer interrupted the decline from the head on November 15. The lengthy lower shadow on the candle demonstrated a sharp rejection of lower prices as the bulls took control on the lows and forced the market to close the session higher. The low of the hammer provided support two days later, where the market again bounced from that region to form a piercing pattern and validated the neckline of the head & shoulders pattern. The piercing pattern is a bullish one that emerges when the market opens below the low of the prior dark candle but manages to eke out a close above the midpoint of the body of the prior candle. These two patterns resulted in a rally to the right shoulder. The right shoulder constituted a bearish engulfing pattern, much like the left shoulder. This bearish engulfing pattern was a strong signal, with the first candle exhibiting a very small body (illustrating indecision). The second candle, and the completion of the bearish engulfing pattern, was a dark candle that enveloped the first candle. This also formed the right shoulder of the head & shoulders pattern. The bearish engulfing pattern was followed by a capitulation session on December 1, which enabled a violation of the neckline and the completion of the pattern. Recent price action on the chart resulted in a variation of the piercing pattern on December 8. An ideal piercing pattern would close above the midpoint of the body of the prior dark candle. Here, light crude just failed to close above the midpoint after opening below the prior session's low and trading higher to close up for the day. This bullish piercing pattern could result in a short-term swing higher in the near term, which would satisfy a common occurrence in head & shoulders patterns: a return to the neckline.
Crude gapsThe head & shoulders pattern can still provide valuable information if things fail to go according to plan. Jack Schwager believes that:
A failed signal is among the most reliable of all chart signals. When a market fails to follow through in the direction of a chart signal, it very strongly suggests the possibility of a significant move in the opposite direction.
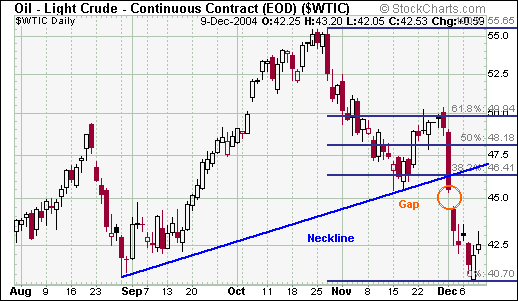
A complete failure of the light crude oil head & shoulders pattern would be the case if there was a close above the right shoulder. For this to happen, the market would need to overcome some important short-term resistance points. The market has a tendency to retrace to the neckline of the pattern, but before that can happen in this case, light crude must fill the bearish gap from December 1 at 45.35 (Figure 4). This gap may be classified as a breakaway gap. Breakaway gaps usually occur at the climax of important patterns — such as the head & shoulders — and they occur on heavy volume. The heavier the volume, the less likely the gap is to be filled.
Figure 4: Breakaway gap. The gap that occurred at the end of the H&S pattern resulted in a breakdown from the neckline a strong support level. Typically, prices retrace to the neckline, but the presence of the gap may diminish the chances of such a retracement in the near term.
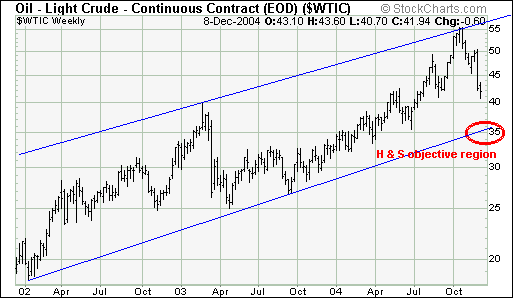
A failure to fill this gap within a week of its formation heightens the chance that a significant move is beginning. Thus, the presence of the potential breakaway gap may diminish the chances of a return to the head & shoulders neckline. A filling of the gap and subsequent move above the neckline would then allow a move toward the right shoulder. A close above the right shoulder would also amount to a move above the 0.618 Fibonacci retracement of the recent push lower from October. This would validate the pattern's failure, suggesting that the longer-term trend is still in force and enabling a push toward new highs. The long-term picture appears to support the view of a move lower in the near term, as the market remains in a well-defined bullish trend channel from early 2002 (Figure 5). The recent rejection of the upper boundary in the 55 region now provides a target, with the lower boundary acting as a magnet. The lower boundary is currently in the vicinity of the head & shoulders objective, and if the market is to replicate the velocity of the 2003 correction from the upper trendline, then a test of that lower boundary could be imminent.
Figure 5: Trend channel. Prices may head toward the lower boundary, which is in the region of the H&S pattern price objective. This lower boundary is one to keep an eye on.
If statistics never lie, then there is not much need to call for the Bible when swearing your allegiance to this reversal pattern. In fact, Thomas Bulkowski, author of Encyclopedia Of Chart Patterns, finds that head & shoulder tops are extremely reliable, with a very low failure rate of 7%.
Chris Manuell is a technical analyst and futures trader. Manuell is an affiliate of the Market Technicians Association and is currently enrolled in the Chartered Market Technicians (CMT) program. He may be reached at chrismanuell5@yahoo.co.uk.
Suggested readingBulkowski, Thomas [2000]. Encyclopedia Of Chart Patterns, John Wiley & Sons.Murphy, John J. [1999]. Technical Analysis Of The Financial Markets, New York Institute of Finance. Nison, Steve [1991]. Japanese Candlestick Charting Techniques, New York Institute of Finance/Simon & Schuster. Schwager, Jack D. [1996]. Schwager On Futures: Technical Analysis, John Wiley & Sons.
Charts courtesy StockCharts.com
Current and past articles from Working Money, The Investor's Magazine, can be found at Working-Money.com.
|
Chris Manuell spent 7 years as a futures sales/trader for a large investment bank and more recently as a technical analyst for an independent research company. He has a bachelor of economics and graduate diploma in applied finance & investment. Currently enrolled in the CMT program with the MTA.
| E-mail address: | chrismanuell5@yahoo.co.uk |
PRINT THIS ARTICLE

Request Information From Our Sponsors
- VectorVest, Inc.
- Executive Premier Workshop
- One-Day Options Course
- OptionsPro
- Retirement Income Workshop
- Sure-Fire Trading Systems (VectorVest, Inc.)
- Trading as a Business Workshop
- VectorVest 7 EOD
- VectorVest 7 RealTime/IntraDay
- VectorVest AutoTester
- VectorVest Educational Services
- VectorVest OnLine
- VectorVest Options Analyzer
- VectorVest ProGraphics v6.0
- VectorVest ProTrader 7
- VectorVest RealTime Derby Tool
- VectorVest Simulator
- VectorVest Variator
- VectorVest Watchdog
- StockCharts.com, Inc.
- Candle Patterns
- Candlestick Charting Explained
- Intermarket Technical Analysis
- John Murphy on Chart Analysis
- John Murphy's Chart Pattern Recognition
- John Murphy's Market Message
- MurphyExplainsMarketAnalysis-Intermarket Analysis
- MurphyExplainsMarketAnalysis-Visual Analysis
- StockCharts.com
- Technical Analysis of the Financial Markets
- The Visual Investor

