

HOT TOPICS LIST
- Strategies
- Stocks
- Buy
- Investing
- Brokers
- Psychology
- Interviews
- Accumulate
- Sell
- Hold
- Spotlight
- Websites
- Candlestick Corner
- Gold & Metals
- Options Trading
LIST OF TOPICS
Trading On Price Perception
01/04/05 08:44:44 AM PSTby Andy Hicks
One of the most important factors to consider when trading stocks is price perception.
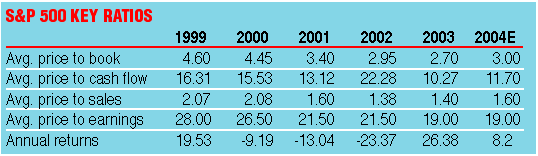
| One of the most important things to consider when trading stocks is the perception of price. I always find it humorous when a stock is pitched based on balance sheet or cash flow metrics. Book value, liquidity, and free cash flow, to name a few, are textbook metrics that have little historical correlation to price perception. They are snapshot measures used to sugar-coat past operational performance, and at best predict a current stock price without future variables. Future price perception for the short-term trader is event-driven and story-related. Stock stories drive expansion for a higher consensus earnings multiple, which in turn derives trading on price perception. (See Figure 1.)
Figure 1: S&P 500 Key Ratios. Source: Baseline (12/16/04)
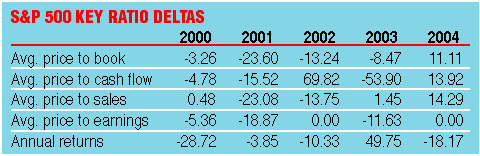
Company fundamentalsOn a per-share basis, price to book and price to cash flow predicts a present value — a floor value, not a future value for stocks. Price to book value predicts an intrinsic value based on a company's current liquidity. Price to cash flow predicts sustained value with possible future dividends, stock buybacks, or acquisitions. Trading on these actions is highly speculative, and is most likely already factored into the price perception (once we hear of the news). Price to book and price to cash flow are good metrics used to set a price floor on stocks you want to short. Obviously, you wouldn't want to short a stock below its book value when it has a healthy cash flow, but you shouldn't buy a stock based on cash flow generation or healthy liquidity. The annual returns for the Standard & Poor's 500 have no correlation to these metrics (see Figure 2).
Figure 2: S&P 500 Key Ratio Deltas. Source: Baseline (12/16/04)
Annual returns are reflective of the growth multiples for the upcoming year, and this extrapolates into trading price perception. Trading on price perception is defined by the delta (change) of the out-year (the year following the current fiscal year) average price to earnings to the delta (change) of current annual returns. On a per-share basis, the only price metric that correlates positively with current annual returns is the average price to earnings for the out-year. For example, in 2000, the delta of annual returns slid -28.72% from its 1999 performance, correlating with the out-year 2001 average price to earnings delta of -18.87% (from the 2000 delta of only -5.36%). Obviously, if we knew the average price to earnings for the out-year, the market would be a much easier trading play, so that is what we need to infer from the correlation of current annual returns data. In 2001, annual returns saw a -3.85% delta (improving from its previous -28.72 delta). This correlates with the actual 0.0% delta of the 2002 average price to earnings (improving from the previous -18.87% delta). Even though the actual average price to earnings was the same at 21.50 times for 2001 and 2002, the year-over-year delta is what we need to examine. In 2002, the annual returns delta slid another -10.33% from the 2001 performance, correlating with the actual 2003 average price to earnings delta of -11.63%. In 2003, the annual returns delta rebounded 49.75% from the 2002 performance, a huge jump, and meanwhile, the current 2004 average price to earnings delta (as of 12/16/04) has only improved to 0.0% from -11.63%. Indeed, the average price to earnings delta for the current year is not reflective of the market optimism of last year. Since there hasn't been any major hiccups this year not to justify last year's annual returns, this imbalance poses a potential trading opportunity for the year-end. Based on this historical correlation (and devoid of external market events), we should see an increased multiple expansion to the S&P 500 for December 2004 as earnings estimates hold firm. Stocks should rise until year-end to allow the 2004 average price to earnings delta to align itself with the 49.75% annual return delta from 2003. (A jump in the 2004 average price to earnings from 19.0x to 20.0x would create a 2004 average price to earnings delta of 5.26% from 0.0%, more reflective of last year's returns.) However, based on the current -18.17% 2004 annual returns delta from the 2003 performance, we would expect the 2005 average price to earnings delta to constrict. This does not necessarily mean depressed stock prices for 2005 if earnings were predicted to rise. Unfortunately, most analysts are guiding for an earnings slowdown in 2005, so stock prices should decline in 2005 to satisfy the correlation. The correlation of annual returns with the out-year average price to earnings delta performs positively for the S&P 500, and is a good gauge for trading exchange-traded funds (ETFs) on this established price perception (namely S&P Depositary Receipts, or SPY, and S&P Midcap Depositary Receipts, or MDY).
For the short termTrading individual stocks is also much easier in the short term, since we can now gauge the December market direction and get a feel for 2005 annual returns (not just based on company and analyst earnings guidance anymore). Once the overall market correlation of annual returns delta to out-year average price to earnings delta is taken into consideration, trading individual stocks on perception of price should consider event and story perception. For example, the potential John Kerry Presidential victory sent stem-cell stocks (STEM, GERN, and so forth) driving upward. A George W. Bush win sent health-care stocks (UNH, HCA, and more) and defense stocks (LLL, LMT, GD, and so on) on the rise. Tech industry buzz over the phenomenal growth of wireless Internet connection stocks (ALVR, AIRN, and so forth) sent those stocks rising over the last six months. The trending demand for cheaper online consumer products sent broadline retailers (OSTK, ECST, and more) sailing forward. As the market trends upward in December (satisfying our correlation), story stocks should have little friction to their rising price perception.
In conclusionBook value, liquidity, and free cash flow and other non-income statement metrics may paint a good picture, but most times don't influence the price. These long-term metrics are inconsequential to trading based on price perception, since the stock market trades in short-term cycles. Stocks trend with the market, and tend with the story, so don't get caught up on meaningless metrics that don't correlate with the price.
Andy Hicks is a licensed investment professional with current experience as an institutional equity trader and an analyst research associate. He may be reached at Hicksak@yahoo.com. Current and past articles from Working Money, The Investors' Magazine, can be found at Working-Money.com. |
| E-mail address: | hicksak@yahoo.com |
PRINT THIS ARTICLE

Request Information From Our Sponsors
- StockCharts.com, Inc.
- Candle Patterns
- Candlestick Charting Explained
- Intermarket Technical Analysis
- John Murphy on Chart Analysis
- John Murphy's Chart Pattern Recognition
- John Murphy's Market Message
- MurphyExplainsMarketAnalysis-Intermarket Analysis
- MurphyExplainsMarketAnalysis-Visual Analysis
- StockCharts.com
- Technical Analysis of the Financial Markets
- The Visual Investor
- VectorVest, Inc.
- Executive Premier Workshop
- One-Day Options Course
- OptionsPro
- Retirement Income Workshop
- Sure-Fire Trading Systems (VectorVest, Inc.)
- Trading as a Business Workshop
- VectorVest 7 EOD
- VectorVest 7 RealTime/IntraDay
- VectorVest AutoTester
- VectorVest Educational Services
- VectorVest OnLine
- VectorVest Options Analyzer
- VectorVest ProGraphics v6.0
- VectorVest ProTrader 7
- VectorVest RealTime Derby Tool
- VectorVest Simulator
- VectorVest Variator
- VectorVest Watchdog