HOT TOPICS LIST
- Strategies
- Stocks
- Buy
- Investing
- Brokers
- Psychology
- Interviews
- Accumulate
- Sell
- Hold
- Spotlight
- Websites
- Candlestick Corner
- Gold & Metals
- Options Trading
LIST OF TOPICS
TRADER'S NOTEBOOK
Fundamentals + Technicals, Together Again
01/05/05 03:16:49 PM PSTby Vikram Murarka
Marrying fundamentals and technicals in the euro/dollar market.
| The best long-term investors do not enter the age-old "fundamentals versus technicals" debate. Instead, they try to combine both analysis techniques to their advantage. This article focuses on how both fundamentals and technicals can be combined in the currency markets and what they say together about the euro/dollar rate.
Fundamentals behind currency ratesIt is perhaps very easy to find the fundamental drivers for the equity markets in general and for individual stocks in particular. Market growth, market share, sales, profits, price/earning ratios, and so on are standard (and very useful) tools in stock-picking. But what are the fundamental drivers behind currency movements? Given that the currency market is most given to technical analysis, the fundamentals are sometimes referred to as "funnymentals." It is understandable that technicals should be the analysis of choice in the currency market, since the lion's share of the daily turnover of $1.9 trillion is speculative. The two major fundamental drivers in the currency market are trade flow and capital flow. Of these, the volume of capital flow is bigger than that of trade flow, and exercises a greater influence on currency rates (Figure 1).
Figure 1: Percent of daily volume by transaction As you can see, a large percentage of the daily turnover is speculative.
The following might sound like heresy in the current climate, in which a weaker dollar is commonly seen as the cure for the US trade deficit, but since the major part of global trade is actually US dollar-denominated, trade flow has minimal impact on currency rates. In addition, the leeway for choosing any currency other than the dollar as the invoicing currency is usually limited. As such, capital flows are considered to be the most important fundamental drivers behind long-term currency movements. Just as water flows downhill, capital flows to where the return on capital is highest. In the currency market, this truism can be expanded to say that capital flows to where the relative return on capital is highest. Long-term currency investors like to watch the changes or movement in the differential between the government bond yields of two countries as a means of forecasting currency movements. Investments flow to that bond market whose yields are comparatively higher. As the bond yields in a country continue to rise relative to the bond yields in another country, there is an increased demand for that country's currency, which drives it higher against the other country's currency. The emphasis here is on long-term investing, because it is at epochal market turning points/trend reversals that fundamentals are at their most potent.
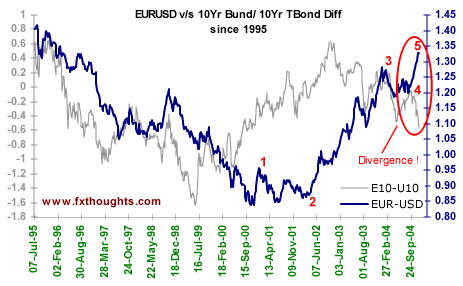
THE BUND-BOND DIFFERENTIALFigure 2 shows the yield differential between the 10-year German Bund (the name for German government bonds, which are taken as a proxy for Euroland bonds because the Eurozone now has a unified monetary policy) and the 10-year US Treasury bond vis-à-vis the euro/dollar exchange rate.
Figure 2: EUR/USD vs. 10-year Bund/10-year Treasury bond differential since 1995. On the left-hand axis, we track the difference between the yields on the 10-year German Bund and the 10-Year US Treasury bond (the gray series). On the right-hand axis, we track the EUR/USD exchange rate (the blue series). The preintroduction rates for EUR/USD have been derived from the dollar/Deutschemark rates converted at the euro/Deutschemark rate.
As you can see, the yield differential, which was 62 basis points in the favor of the Bund in July 1995, declined to a negative 159 basis points by June 1999, over roughly four years. During this period the EUR/USD rate fell from 1.4171 to 1.0535. We then encountered a 16-month lag, although the yield differential rose from -1.59% in June 1999 to -0.507% in November 2000. The euro continued declining against the dollar and hit a low of 0.8378 in November 2000 before embarking on a long-term up move. From November 2000 to November 2002, the two series moved in tandem, with the yield differential rising from -0.507% to +0.608% and the EUR/USD rate rising from 0.8378 to 1.0098. Note the overall positive correlation between the yield differential and the exchange rate over a long period of time. The former is a leading indicator of the latter. You can find a lead-adjusted version of Figure 2 at the end of this article, along with correlation details.
Skating on thin ice?At present, the Bund/bond differential has again slipped deep into the negative, diving from near -0.05% on October 17, 2004, to -0.57% on December 3, 2004. This means that the yield differential currently supports the dollar and not the euro. Yet, the euro has shot up against the dollar since September 4. Thus, there is a stark divergence between the differential and the exchange rate today, suggesting that the euro lacks important fundamental support. If we now bring in the technicals and impose an Elliott wave count on the euro/dollar chart, it may seem that the euro could be skating on thin ice. Let's go over the wave count:
We may now be in the final wave 5 of the big up move that started from 0.8378 in November 2000. According to Elliott wave theory, the fifth wave is usually the most speculative. It's the time when all the latecomers join the party, usually after the fundamental drivers of the big trend have changed. This is so starkly visible in the chart that it seems to cry out for attention. While the euro may well continue to strengthen in the short term, long-term investors may want to buy some protection against a euro fall.
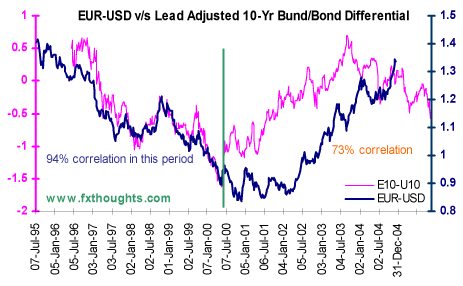
Lead-adjusted chartThe relation between the Bund/bond differential and the dollar/Deutschemark rate was very close (at 94%) until the introduction of the euro. This can be seen in Figure 3, where the 12-month lead-adjusted 10-year Bund/bond differential is juxtaposed against the EUR/USD rate.
Figure 3: Lead adjusted 10-year Bund/bond differential chart.
The relation between the Bund/bond differential and the EUR/USD rate is looser now (at 73%), because the euro represents many countries, not just Germany. Yet this is a high-enough correlation to warrant consideration.
Murarka Vikram is chief currency strategist for Kshitij.com. He may be reached at Vikram@Kshitij.com. Current and past articles from Working Money, The Investors' Magazine, can be found at Working-Money.com. |
| E-mail address: | vikram@kshitij.com |
PRINT THIS ARTICLE

Request Information From Our Sponsors
- VectorVest, Inc.
- Executive Premier Workshop
- One-Day Options Course
- OptionsPro
- Retirement Income Workshop
- Sure-Fire Trading Systems (VectorVest, Inc.)
- Trading as a Business Workshop
- VectorVest 7 EOD
- VectorVest 7 RealTime/IntraDay
- VectorVest AutoTester
- VectorVest Educational Services
- VectorVest OnLine
- VectorVest Options Analyzer
- VectorVest ProGraphics v6.0
- VectorVest ProTrader 7
- VectorVest RealTime Derby Tool
- VectorVest Simulator
- VectorVest Variator
- VectorVest Watchdog
- StockCharts.com, Inc.
- Candle Patterns
- Candlestick Charting Explained
- Intermarket Technical Analysis
- John Murphy on Chart Analysis
- John Murphy's Chart Pattern Recognition
- John Murphy's Market Message
- MurphyExplainsMarketAnalysis-Intermarket Analysis
- MurphyExplainsMarketAnalysis-Visual Analysis
- StockCharts.com
- Technical Analysis of the Financial Markets
- The Visual Investor


