HOT TOPICS LIST
- Strategies
- Stocks
- Buy
- Investing
- Brokers
- Psychology
- Interviews
- Accumulate
- Sell
- Hold
- Spotlight
- Websites
- Candlestick Corner
- Gold & Metals
- Options Trading
LIST OF TOPICS
THE OPTIMIZED TRADER
Charting Options
01/27/05 12:48:38 PM PSTby David Penn
We're not talking bars versus candlesticks. We're talking about putting the price action of puts and calls themselves on the map.
Full disclosure: I never thought about charting actual options before reading a tantalizingly brief comment on charting options in Price Headley's excellent book, Big Trends In Trading. If you never thought about charting options either, then don't feel too bad. Truth be told, though, Price Headley has been wondering about you guys for some time. Here's how he tells it:
If you think I was kidding when I say that Headley's remarks on charting options was "tantalizingly brief," then realize that the quoted paragraph represents a full third of what he has to say on the subject in Big Trends. I suspect those who are particularly interested in adding this approach to trading options to their options trading toolbox will have some success at Headley's website, Bigtrends.com. But those who find the concept compelling after reading Headley's remarks in Big Trends in Trading are likely to find themselves a bit wanting if they limit themselves to that resource. Then again, how much more needs to be said? Headley provides one straightforward technique for trading options based on their charts. But anyone with experience (and confidence) in their ability to anticipate the price movement of stocks, futures, or currencies when looking at a chart of their behavior is probably already sufficiently proficient to begin looking at charts of options, trying out different indicators, oscillators, candlestick patterns, and so forth to see what can be seen.
From stock chart to options chartHere's an example of one way of using options charts to supplement an observation made on a stock chart. Back in early January, I wrote an article for Traders.com Advantage ("Newmont's Head And Shoulders Top") suggesting that a head & shoulders top in Newmont Mining (NEM) was likely anticipating lower prices.
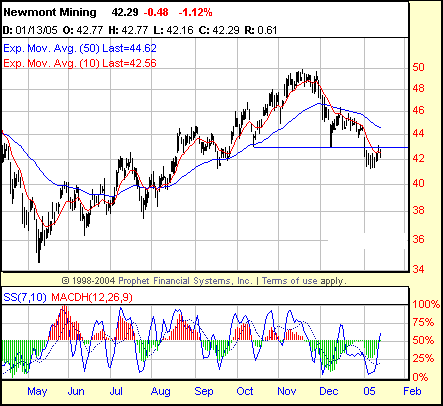
Figure 1: A January pullback in Newmont Mining may only be a pause before the breakdown from the head & shoulders top reasserts itself.
As it appears in mid-January 2005, NEM has broken down below the neckline of the head & shoulders top, and currently looks to be pulling back to test the neckline for resistance (at about 43 or so). While it is certainly possible that the pullback could turn into a more serious bounce, one that might even make the outlook for a bearish head & shoulders top untenable, there remain several factors that undergird the bearish argument — at least for now. In addition, with a formation high of about 50 and a neckline at 43, this head & shoulders top projects a minimum downside of about seven points to 36. Such a decline would virtually erase the entire move of NEM, taking the stock close to levels it hasn't seen since it established its bottom in May 2005 near 35. While there is nothing wrong with simply shorting the stock, those who prefer (or are even just interested in) trading the potential breakdown in NEM with options could take a look at a chart of, in this example, the March 2005 40 puts. With strikes at $45 and $42.50, these puts are currently one-strike out-the-money. There are a number of recommendations for options traders when it comes to trading in-the-money, at-the-money, and out-the-money options, with the majority of these recommendations suggesting in-the-money options as the best way to trade naked, directional options plays. Teresa Lo of PowerSwings.com was quoted in her interview with Mark Ingebretsen (in The Guts & Glory Of Day Trading) as saying that she prefers to "buy options that are at the money and within one or two weeks of expiration," adding that "this minimizes the premium you pay for the option's time value." Larry McMillan, while providing caveats, encourages a similar approach to option buying in his book Profit With Options, writing that:
Others, such as Kenneth R. Trester in his book The Compleat Option Player take a different tack on the "blank-the-money" issue. He writes:
Options which are "in-the-money" are far too fat for the option buyer, and although they may have intrinsic value, they also have far more risk. Out-of-the-money options normally will have much lower prices, and as a result, will have less risk and far more leverage.
Price Headley, whose money management rules for options trades are quite worthwhile, says that in addition to always buying one more month and one strike price further in from what he thinks he'll need, he prefers more expensive options:
If you buy an option at the market at 1.20 when it is bid 1.00 and offered 1.20, you are already looking at a 16.7 percent loss if you turn right around and sell it at the bid of 1.00. That is why most of the options I buy are in the $3 to $8 range, where these bid/ask spreads are not so wide on a percentage basis.
I'm hardly in a position to quibble with any of this advice. Suffice it to say that I feel most comfortable with options that are one strike away, priced around $1.00, and within a few weeks of expiration. Much of the price you pay for an option, of course, is determined by how early in its move you catch it — another point Headley underscores, writing " your entry level is critical, as it determines how much of a loss you are willing to accept before abandoning the trade. The closer you can get your entry to your 'make or break' level, the lower your risk will be, and the higher your Reward-to-Risk ratio will be."
On options chartingThis is one of the areas where charting with options can be helpful for those who enjoy working with charts for stocks, futures, and currencies. By using a variety of techniques such as divergences, pattern recognition, and support/resistance, options chartists can spot entry levels that are very close to the make-or-break level that Headley is talking about. In the same way that a stock chartist can determine the relative cheapness of a stock based on support levels and recent price action, so can an options chartist use the same or similar tools to spot levels where the reward-to-risk ratio is significant enough for a trade.
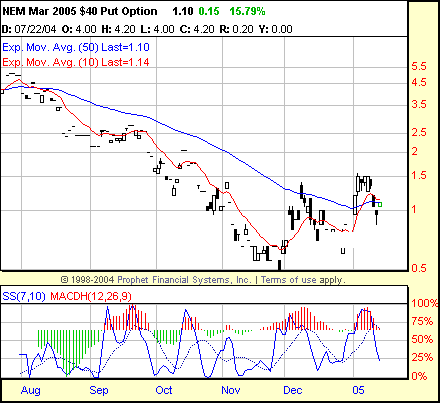
Figure 2: Positive stochastic divergences in late November and December suggest higher prices for this option on shares of Newmont Mining.
Consider Figure 2, of the Newmont Mining March 2005 $40 put. I'm using a strike of 40 because that is the closest out-the-money price to where NEM was last trading (about 42; there is an in-the-money put at 42.50). One thing that is interesting about using options charts is that an options chartist can look at charts of January, February, and March expirations, as well as charts with 42.50, and even 37.50 or 45 strikes to see which charts are displaying the most promising technical pictures. Note how this NEM 40 put has made positive stochastic divergences on both its declines in late November and again in December. This would be a particularly bullish technical development if we were looking at a stock or futures chart, and it is no less promising as a bullish portend simply because the tradable in the chart is an option. The 10-day exponential moving average (EMA) has crossed above the 50-day EMA in January, and this after making a higher low in December vis-à-vis November. The options also appear to be oversold based on the 7,10 stochastic, and the black hammer candlestick on the most recent decline only adds to the list of reasons why this option could quite logically move higher. One especially nice options chart I came across last night was the chart of the General Motors January 40 puts.
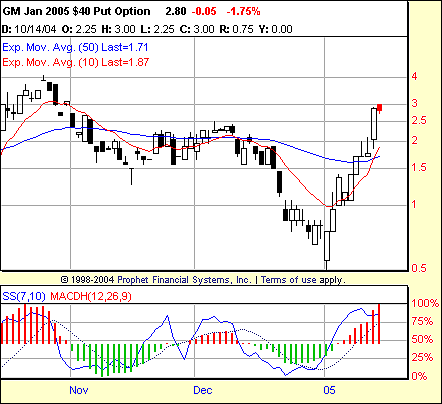
Figure 3: A positive stochastic divergence anticipates a major reversal in the new year for the GM 40 put.
I won't bother to post a chart of the underlying in this example. But I do want to highlight some similarities between this chart of the GM January 40 put and the NEM March 40 put. In particular, note the positive divergence between the higher 7,10 stochastic lows over the mid-December/early January time frame and the lower lows in the price of the option. Again, this is a classic indicator pattern that very often develops when bottoms of some significance and duration are made. An entry on January 4 (the day after the low day) would have provided nearly a 300% profit in about nine days — and this without so much as threatening to take out a break-even stop. This discussion is intended primarily as an introduction to options charting for those who are curious about different ways to make money in the options market. The few months I've spent looking at options charts have already convinced me that they are certainly worth spending more time studying. In this, I have to compliment Prophet Financial Systems — of whose charts I was already a massive fan — for their superb options charts. In my somewhat limited experience, I have yet to come across many sources for those interested in charting options with the same toolset used to chart stocks, futures, and currencies. And of those options charting sources I have discovered, Prophet.net's charts are as good if not better.
Technical Writer David Penn may be reached at DPenn@Traders.com.
Suggested readingHeadley, Price [2002]. Big Trends In Trading, John Wiley & Sons.Ingebretsen, Mark [2001]. The Guts & Glory Of Day Trading, Prima Publishing. McMillan, Lawrence G. [2002]. Profit With Options, John Wiley & Sons. Penn, David [2005]. "Newmont's Head And Shoulders Top," Traders.com Advantage: January 5. Trester, Kenneth R. [1992]. The Compleat Option Player, Institute for Options Research, Inc. Prophet.net Current and past articles from Working Money, The Investors' Magazine, can be found at Working-Money.com.
|
Technical Writer for Technical Analysis of STOCKS & COMMODITIES magazine, Working-Money.com, and Traders.com Advantage.
| Title: | Traders.com Technical Writer |
| Company: | Technical Analysis, Inc. |
| Address: | 4757 California Avenue SW |
| Seattle, WA 98116 | |
| Phone # for sales: | 206 938 0570 |
| Fax: | 206 938 1307 |
| Website: | www.traders.com |
| E-mail address: | DPenn@traders.com |
Traders' Resource Links | |
| Charting the Stock Market: The Wyckoff Method -- Books | |
| Working-Money.com -- Online Trading Services | |
| Traders.com Advantage -- Online Trading Services | |
| Technical Analysis of Stocks & Commodities -- Publications and Newsletters | |
| Working Money, at Working-Money.com -- Publications and Newsletters | |
| Traders.com Advantage -- Publications and Newsletters | |
| Professional Traders Starter Kit -- Software | |
PRINT THIS ARTICLE

Request Information From Our Sponsors
- StockCharts.com, Inc.
- Candle Patterns
- Candlestick Charting Explained
- Intermarket Technical Analysis
- John Murphy on Chart Analysis
- John Murphy's Chart Pattern Recognition
- John Murphy's Market Message
- MurphyExplainsMarketAnalysis-Intermarket Analysis
- MurphyExplainsMarketAnalysis-Visual Analysis
- StockCharts.com
- Technical Analysis of the Financial Markets
- The Visual Investor
- VectorVest, Inc.
- Executive Premier Workshop
- One-Day Options Course
- OptionsPro
- Retirement Income Workshop
- Sure-Fire Trading Systems (VectorVest, Inc.)
- Trading as a Business Workshop
- VectorVest 7 EOD
- VectorVest 7 RealTime/IntraDay
- VectorVest AutoTester
- VectorVest Educational Services
- VectorVest OnLine
- VectorVest Options Analyzer
- VectorVest ProGraphics v6.0
- VectorVest ProTrader 7
- VectorVest RealTime Derby Tool
- VectorVest Simulator
- VectorVest Variator
- VectorVest Watchdog


