HOT TOPICS LIST
- Strategies
- Stocks
- Buy
- Investing
- Brokers
- Psychology
- Interviews
- Accumulate
- Sell
- Hold
- Spotlight
- Websites
- Candlestick Corner
- Gold & Metals
- Options Trading
LIST OF TOPICS
FOCUS ON
More Elliott Wave Work
02/16/05 12:04:58 PM PSTby David Penn
Here's an update and extension on the wave count discussed in "Elliott Wave 2005."
| In a recent article for Working-Money.com ("Elliott Wave 2005," January 12, 2005), I suggested an Elliott wave count that considered the current market to be in the late stages of a cycle B rally that began in October 2002. Interestingly enough, this view — broadly speaking — has some adherents. The Wall Street Journal last week published an article in its "Money & Investing" section by E.S. Browning. Browning quotes Eric Bjorgen of Leuthold Weeden as saying:
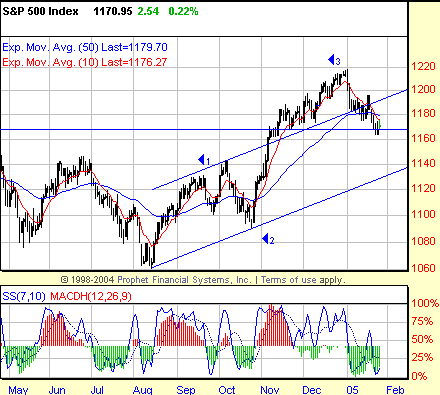
Right now, the Standard & Poor's 500 is in a fourth-wave correction. Moving up from the cycle B lows in August, the S&P 500 has already finished three waves — the advance from the August lows to the top in mid-September (or early October; the negative stochastic divergence signaling a top suggests September, however) represented the first wave. The second wave extended from that top to the late October lows, and the third wave stretched from those October lows to the peak at the end of December. Inasmuch as the January correction represents a fourth wave, traders can expect a few things of it as it runs its course. The first, and most crucial, is that if this correction is a fourth wave, then it should not fall any lower than the value at the peak of wave one, or 1140. Interestingly — but probably not coincidentally — this is where the lower boundary of the August 2004 trend channel lies. The second expectation of the current correction is that it should differ significantly from the previous, wave two, correction in the autumn of 2004. This is because of the rule of alternation, which A.J. Frost and Robert Prechter explain in their classic Elliott Wave Principle as "a useful rule to keep in mind in analyzing wave formations and assessing future possibilities." They continue:
Wave two that developed over autumn is a "simple complex" pattern. Letting the negative stochastic divergence highlight the true top of wave one in mid-September rather than in earliest October, the correction that is wave two appears to be a flatan irregular or expanded flat, to be specific. This sort of flat occurs when the "b" of the a-b-c flat moves beyond the high of the previous wavein this case, the wave one high in mid-September. Consider how the Elliott wave analysts of Prognosis Software Development, makers of the ELWAVE Elliott wave software program, describe this kind of corrective pattern:
This sounds to me like exactly what has taken place with the wave two correction, including the notion of a "strong acceleration" that follows such a correction. Truly, the sharp spike at the end of September going into October is indicative of the kind of strong B wave mentioned. So what does this suggest of the current wave four correction? The rule of alternation suggests that, at a minimum, what we should see in wave four is a zigzag. This also appears to have been borne out by the S&P's correction in January. The most common descriptions of zigzags all underscore that these corrections often augur a "sharp reversal" that often " looks like an impulsive wave, because of the acceleration it shows" (from Prognosis). In fact, this acceleration has been so sharp and strong, some are wondering whether the early January 2005 highs represent the peak (and end) of the October 2002 to represent the bull market. If wave four is a zigzag, then it should be composed of three parts (a-b-c) with the "a" and "c" components further subdivided into five parts each (wave b is subdivided into three parts). Looking at the growing correction in the S&P 500 since January, can these subdivisions be spotted and marked?
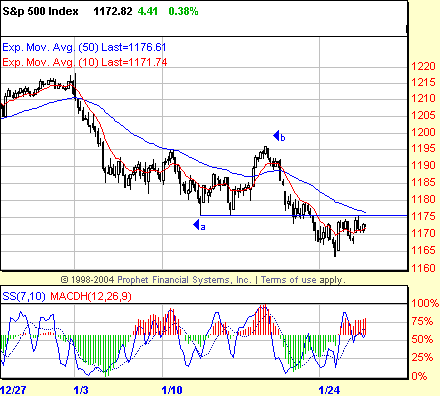
At this point, my best guess is that wave a of this wave four was completed with the lows on January 12, and that wave b of this wave four was completed with the rally peak on January 18. This leaves a wave c of wave four that — if this analysis is correct — will likely break down below the lower boundary of a downward trend channel that can be drawn from the wave three top on January 3. This breakdown would be en route to a test of the 1140 level — the top of wave one. Again, if this analysis is correct, then the 1140 should serve as solid resistance on a closing basis and set the stage for a wave five rally that should set new year-to-date highs. One quick check of this analysis will come if the gyrations of wave four here on January 26 do not include a venture above the 1177 level or so. That was the low point of the initial wave a of the wave four zigzag. If the market entered a wave c of the wave four zigzag after January 18, then prices should not move into the price territory of wave a — that is, above 1177. The positive stochastic divergences shown in the hourly S&P 500 chart in Figure 2 suggest caution on the part of the bears, but a breakdown below 1165 or so would underscore the idea that the S&P 500 is still in its corrective phase. David Penn may be reached at DPenn@Traders.com.
Suggested readingBrowning, E.S. [2005]. "History May Suggest This Bull Market Is In Last Round," Prophet Financial Systems
Current and past articles from Working Money, The Investors' Magazine, can be found at Working-Money.com.
ELLIOTT WAVE Update The rally in the S&P 500 on February 4 pushed the market above the 61.8% retracement level of the decline from the December 28th peak (basis closing highs). This means that the January correction is most likely not a zigzag. Most generally, this means that the correction low just south of 1165 should hold for the duration of the correction. By saying "duration of the correction," I am considering a number of different possibilities. Starting from the smallest revision of the previous analysis, there is a chance that the wave one peak occurred with the early October high (instead of the lower September high) in 2004. There is negative stochastic divergence support for a top in early October. The significant of this revision is that now wave two — the decline from the October highs to the October lows — is more likely a zigzag than a flat. Keeping in mind the rule of alternation, this would suggest that wave four — the January/February 2005 correction — is a flat rather than a zigzag, as suspected previously. If the January/February 2005 correction is a flat, any new high for the year — at this juncture — should be limited, as should any decline from mid-February levels. Barring a more unorthodox flat, the correction should be contained within the 2005 highs and the 2005 lows. There are other possibilities, of course. One interesting possibility holds that the cycle bull market from the October 2002 lows ended in December 2004-January 2005. Per this view, the January correction was the first of what will be a dizzying series of declines toward a cycle c bottom many, many points from here. At this time, however, I'm assuming that the market is not quite done with its correction. If this is the case, and the market is working its way through a corrective flat, then the bullishness of late January and early February would be attributable to the "b" wave of that a-b-c corrective pattern. This would be followed by a bearish "c" wave correction to complete wave four, and subsequently, a march toward new highs in the S&P 500. —DP
|
Technical Writer for Technical Analysis of STOCKS & COMMODITIES magazine, Working-Money.com, and Traders.com Advantage.
| Title: | Traders.com Technical Writer |
| Company: | Technical Analysis, Inc. |
| Address: | 4757 California Avenue SW |
| Seattle, WA 98116 | |
| Phone # for sales: | 206 938 0570 |
| Fax: | 206 938 1307 |
| Website: | www.traders.com |
| E-mail address: | DPenn@traders.com |
Traders' Resource Links | |
| Charting the Stock Market: The Wyckoff Method -- Books | |
| Working-Money.com -- Online Trading Services | |
| Traders.com Advantage -- Online Trading Services | |
| Technical Analysis of Stocks & Commodities -- Publications and Newsletters | |
| Working Money, at Working-Money.com -- Publications and Newsletters | |
| Traders.com Advantage -- Publications and Newsletters | |
| Professional Traders Starter Kit -- Software | |
PRINT THIS ARTICLE

Request Information From Our Sponsors
- StockCharts.com, Inc.
- Candle Patterns
- Candlestick Charting Explained
- Intermarket Technical Analysis
- John Murphy on Chart Analysis
- John Murphy's Chart Pattern Recognition
- John Murphy's Market Message
- MurphyExplainsMarketAnalysis-Intermarket Analysis
- MurphyExplainsMarketAnalysis-Visual Analysis
- StockCharts.com
- Technical Analysis of the Financial Markets
- The Visual Investor
- VectorVest, Inc.
- Executive Premier Workshop
- One-Day Options Course
- OptionsPro
- Retirement Income Workshop
- Sure-Fire Trading Systems (VectorVest, Inc.)
- Trading as a Business Workshop
- VectorVest 7 EOD
- VectorVest 7 RealTime/IntraDay
- VectorVest AutoTester
- VectorVest Educational Services
- VectorVest OnLine
- VectorVest Options Analyzer
- VectorVest ProGraphics v6.0
- VectorVest ProTrader 7
- VectorVest RealTime Derby Tool
- VectorVest Simulator
- VectorVest Variator
- VectorVest Watchdog


