HOT TOPICS LIST
- Strategies
- Stocks
- Buy
- Investing
- Brokers
- Psychology
- Interviews
- Accumulate
- Sell
- Hold
- Spotlight
- Websites
- Candlestick Corner
- Gold & Metals
- Options Trading
LIST OF TOPICS
TRADER'S NOTEBOOK
Using Cycles Data
03/16/05 12:55:56 PM PSTby Rudy Teseo
If "what goes up must come down" is true, then there must be a way to use that information. Here's how.
| If there's one phenomenon that almost everyone has a different definition for, it's the cycle. That's because we think of cycles within our own sphere of reference. To the gardener, it's the seasons. To the economist, it's the business cycles. To the fisherman or boatman, it's the tide changes. But for our purposes, let's think of cycles as the ups and downs of the stock market. Every stock, commodity, and index has a predominant cycle — the rhythmic movement of price swings between highs and lows. I have found that cycles occur in some derivative of the numbers three and four. The predominant cycles are three- to four-week cycles, three- to four-month cycles, six- to eight-month cycles, and three- to four-year cycles. Cycle durations are fixed to their corresponding vehicle. If an index has a four-month cycle, it will never be three-month or a six-month. If a stock has a three-month cycle, it will never be a four-month or an eight-month. Can this knowledge be used to predict market reversals in the same way that we use price patterns and Elliott wave reversal signals? The answer, of course, is a resounding yes, if we only know how to count. There are several tools that can help us do this. Stock charting programs such as MetaStock have built-in cycle indicators. Or if you want to go it alone, there's our old friend, the moving average.
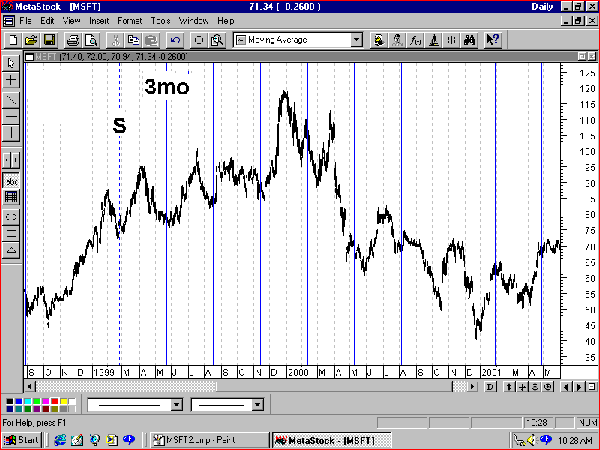
Metastock Cycle LinesFigure 1 shows a daily chart of Microsoft (MSFT) with cycle lines set to three months, starting at point S. I set the cycle start point at an arbitrary price low and adjusted the cycle time lines back and forth. In doing so, I found the three-month cycle to be a better fit than a four-month cycle. The solid lines identify these cycles. Although not a perfect fit, each cycle is close to, if not coincident with, a price bottom. This means that using cycles as an entry system does have potential.
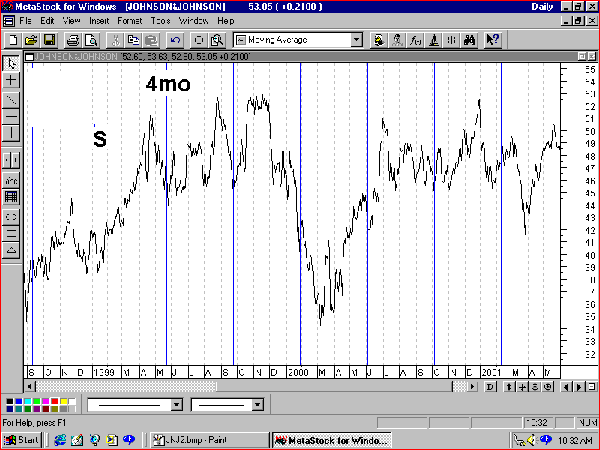
Figure 2 shows a daily chart of Johnson & Johnson (JNJ) with a four-month cycle line. Here, a four-month cycle fit (as seen by the solid lines) is better than a three-month cycle. This was found strictly by experimenting, as with the chart of MSFT. Again, although not perfect, there were enough hits to suggest this might make a good system. Note especially the March 2000 low, and the substantial gain that might have been attained by entering here.
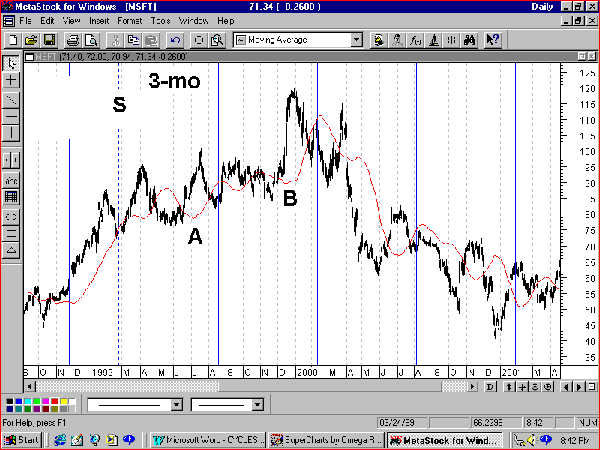
Moving AveragesFortunately, the program I use has a cycle indicator but if your charting program does not, all is not lost. You can use a moving average (MA) to signal price bottoms. It has long been recognized that there is a definite relationship between cycles and moving averages. The key is selecting the correct cycle/moving average combination. Three-month and four-month cycles seem to provide the best fit for common stocks, and a 30-day moving average has proven to be a good companion for these cycles. What you're looking for is a trough in the MA, which (ideally) will signal a price bottom or a potential cycle bottom. In Figure 3 you see the MSFT chart again with a 30-day moving average as well as a three-month cycle indicator. Allowing for the lag in the MA, the dips in the MA line follow the price low very closely. Of course, if you wait for the completion of the dip and an upward MA, most of the price rise may be missed, as shown at A and B. However, if you develop confidence in this system and trust the movement of the stock crossing above the downward MA as a signal that a bottom has been made, you can capture most of the move.
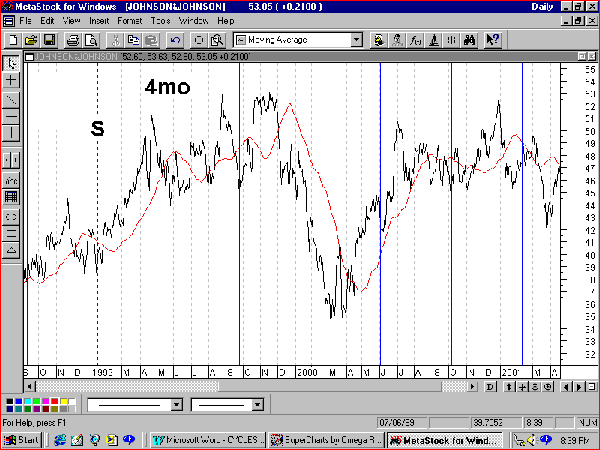
Figure 4 shows JNJ with a 30-day MA as well as a four-month cycle indicator. In this case, even waiting for the completion of the trough in the moving average would have captured most of the up moves in the price.
Figure 4: Four-month cycle lines and 30-day MA. Here also you see a similar scenario.
There is no objective method of finding the right cycle. It will take some experimenting, backtesting, and chart scrutiny. There are some general guidelines, however. For intermediate-term stock trading, a three- to four-month cycle with a 30-day moving average appears to work well. History shows that the average cycle for most stocks is a three-and-a-half-month cycle (39 weeks). Keep this in mind while trying for the best fit in the stocks of your interest. For short-term trading, you will want to try three- to four-week cycles.
Rudy Teseo has taught courses in option trading and basics of stock charting. He may be reached at rftess@juno.com. Current and past articles from Working Money, The Investors' Magazine, can be found at Working-Money.com.
|
Rudy Teseo is a private investor who trades stocks, options, and currencies. He has taught classes in technical analysis and option trading. He may be reached at rftess@optonline.net.
| E-mail address: | rftess@optonline.net |
PRINT THIS ARTICLE

Request Information From Our Sponsors
- StockCharts.com, Inc.
- Candle Patterns
- Candlestick Charting Explained
- Intermarket Technical Analysis
- John Murphy on Chart Analysis
- John Murphy's Chart Pattern Recognition
- John Murphy's Market Message
- MurphyExplainsMarketAnalysis-Intermarket Analysis
- MurphyExplainsMarketAnalysis-Visual Analysis
- StockCharts.com
- Technical Analysis of the Financial Markets
- The Visual Investor
- VectorVest, Inc.
- Executive Premier Workshop
- One-Day Options Course
- OptionsPro
- Retirement Income Workshop
- Sure-Fire Trading Systems (VectorVest, Inc.)
- Trading as a Business Workshop
- VectorVest 7 EOD
- VectorVest 7 RealTime/IntraDay
- VectorVest AutoTester
- VectorVest Educational Services
- VectorVest OnLine
- VectorVest Options Analyzer
- VectorVest ProGraphics v6.0
- VectorVest ProTrader 7
- VectorVest RealTime Derby Tool
- VectorVest Simulator
- VectorVest Variator
- VectorVest Watchdog


