HOT TOPICS LIST
- Strategies
- Stocks
- Buy
- Investing
- Brokers
- Psychology
- Interviews
- Accumulate
- Sell
- Hold
- Spotlight
- Websites
- Candlestick Corner
- Gold & Metals
- Options Trading
LIST OF TOPICS
TRADER'S NOTEBOOK
Less Is More
03/23/05 11:18:58 AM PSTby Mark Phillips
Can the true strength index take the subjective guesswork out of stochastics?
| As is the case with many new traders, this isn't the career I trained for. As an engineer, I learned to view problems and their solutions in black & white terms. So when I entered the world of trading nearly a decade ago, I looked for analytical tools that could be interpreted in much the same manner. Over the years, I've tried and discarded more technical analysis tools than I can remember. This is because what I found worked in one set of market conditions failed miserably in others. In my experience, most oscillators fall into this category. It isn't that they aren't valuable tools, but rather that they can only be reliably applied in certain market conditions and must be viewed skeptically in others.
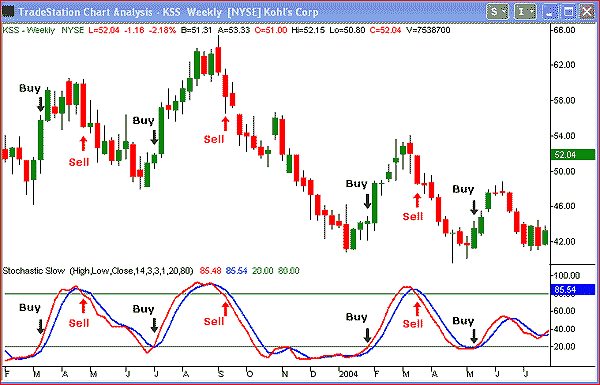
the perfect indicator?One of the most widely used oscillators is stochastics, a simple oscillator developed by the late George C. Lane in the 1950s. It is made up of two lines (fast and slow), crossing over one another and regularly traversing between the minimum of zero percent and the maximum of 100%. Typically, above 80% is deemed to be overbought and below 20% is the threshold for oversold. When both lines are in oversold territory, the fast line crosses back above the slow line and then rises above 20%, forming a buy signal. Conversely, when both lines are in overbought territory, the fast line crosses below the slow line, dropping below 80%, and is considered a sell signal. In Figure 1 a weekly chart of Kohl's Corp. (KSS), demonstrates the ideal application of the stochastics oscillator. Buy when the fast line (red) crosses above the slow line (blue) and emerges from oversold territory. Similarly, sell signals are generated when the red line crosses below the blue and emerges from the overbought region.
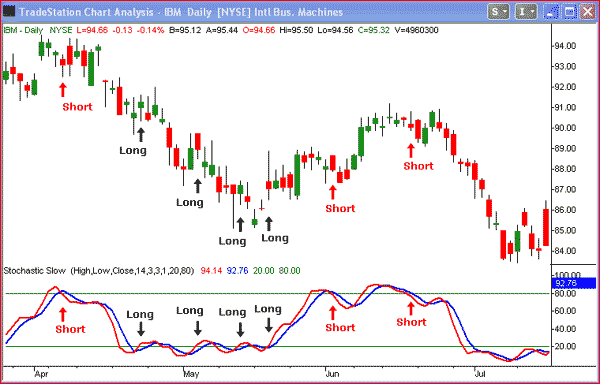
Figure 1: Simple use of stochastics. Application of stochastics for buy and sell signals yielded solid gains on the weekly chart of KSS over this 18-month period. Unfortunately, there are some problems in this simple interpretation. First off, there are two or three parameters (depending on the charting platform) for stochastics and you could use any set of parameters that you find suits your needs. In other words, there is a high degree of subjectivity in both the setup and interpretation of the oscillator. This isn't necessarily a negative, but something we must be aware of before applying any collection of settings as the "correct" values. For analytical traders like me who desire a black & white interpretation from their technical indicators, this can present some unique challenges. While rigid analysis of the performance of any indicator is what gives the analytical trader confidence in its application, that confidence can often be misplaced if the settings chosen are too closely matched to current market conditions — that is, curve-fitting the results. Put another way, we can come up with a set of parameters on a highly variable indicator like stochastics that will perform well in just about any given market condition. When market conditions change, however, the initial settings may very well perform poorly. This won't become apparent until actual trade results begin to suffer. Then the trader is confronted with the dilemma of wondering whether the indicator is flawed or if the wrong set of parameters was chosen. As you can see, this kind of constant variability is enough to drive a highly analytical trader to distraction! The other concern with stochastics is that it is a range-limited or "normalized" function. Once it gets buried deep in overbought or oversold territory (readings above 95% or below 5%, respectively), there will be very little additional movement, regardless of how strongly price action trends in that direction. This is true with all normalized oscillators (those that are scaled to remain within a predetermined range, typically from zero to 100), as they can become pegged in overbought/oversold territory in strong trending moves. As a result, stochastics and most other oscillators may be very good tools for dealing with range-bound price action (allowing the trader to buy tops and sell bottoms within the range), but they become essentially worthless for interpreting price action in strong directional trends. (Figure 2).
Figure 2: Stochastics stumbles. Applied to the daily IBM chart, stochastics alone generates far more losing trades than winning ones. When price action transitions from range-bound to trending, we need to place less stock in the signals from our stochastics oscillator and more on other technical tools that perform well in a trending market. The catch is, how do we know when that transition takes place? If we could make that determination, we could just rely on that same crystal ball to make our buy and sell decisions, and avoid the use of any technical indicators, right? The basic behavior of oscillators is useful, but lacking a way to determine the dividing line between trending and range-bound markets has significant limitations. What is really needed is an indicator that can respond to directional changes within the trading range, while still providing useful information when the trading range gives way to trending action. That is, define the problem first and then offer the solution. Doesn't that sound just like an engineer?
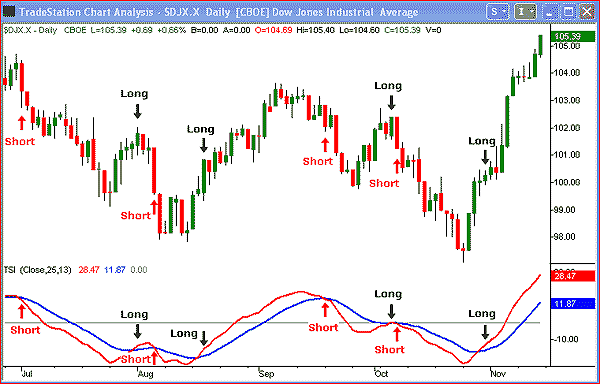
the indicator that couldAfter much reading, research, and experimentation, I stumbled across a little-known oscillator called the true strength index (TSI) [see sidebar, "The true strength index"]. Though it was first described in Stocks & Commodities in 1991, I found it in the book Momentum, Direction, And Divergence, where the indicator's creator, William Blau, describes his rationale for creating this oscillator, along with all of the pertinent details, including the formula. What really caught my attention was a note inside the dust jacket — before becoming a trader, Blau was an engineer. Birds of a feather flock together, I remember thinking. I highly recommend the book, but must point out that it is a technical text. Filled with equations, derivations, and ample chart examples, it is not light reading, but it will appeal to many students of technical analysis. "The proof of the pudding is in the eating," as the saying goes, and Blau doesn't disappoint. The TSI addresses the primary concerns of most oscillators, beginning with the subjectivity of multiple parameters. While there are two parameters that can be set for the TSI, the default setting of (25,13), in my opinion, seems to work best. I have found that significantly changing those settings does not appreciably change the character of the oscillator, providing a black & white indicator, where the settings are fixed. The second challenge presented by most oscillators is the fact that they are range-limited, becoming essentially useless at the extremes. TSI doesn't suffer from that limitation, as it continues to rise in uptrending markets and fall in downtrending markets. The primary difficulty with the application of this tool is that it is not included in most charting applications. However, since Blau provides all the pertinent equations, you can take that information and create your own custom indicator within any charting package with the ability for customization. The basic interpretation of the TSI can be seen in Figure 3. Whenever the fast line (red) crosses below the slow line (blue) a sell signal is generated. A buy signal is generated whenever the fast line crosses above the slow line. A further refinement would be to take short signals only when the bearish crossover occurs above the zero line and take long signals only when the crossover occurs below the zero line.
Figure 3: Smoothing out the noise. The daily chart of the Dow shows how simple the application of the TSI can be. Of course, it would be simple to cherry-pick some examples where the TSI looks like the perfect "crystal ball" indicator. The best way to show its utility is through a direct comparison, showing how TSI eliminates many of the false signals endemic to stochastics and other range-bound oscillators.
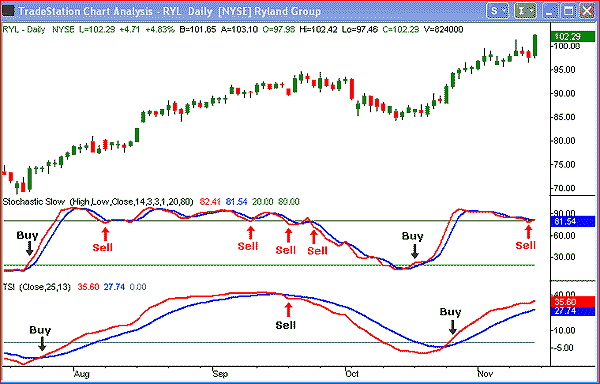
tsi vs. stochasticsIn Figure 4, you can see four months of price action for the Ryland Group (RYL) where the TSI issued two long signals that would have been good for solid profits, along with one sell signal, which would have resulted in a small loss or small gain, depending on the size of the initial stop. In contrast, the stochastics oscillator issued seven signals in the same span of time.
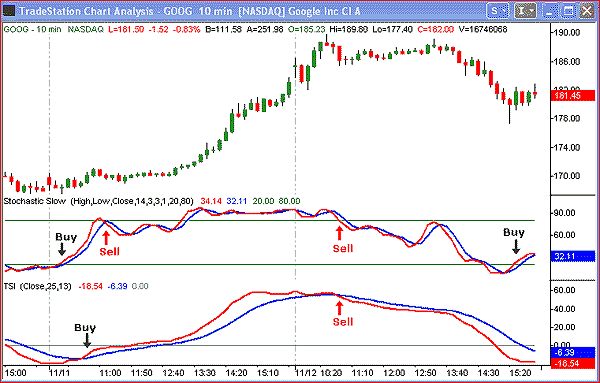
Figure 4: Head-to-head comparison. Through this four-month period of trending action, TSI handily outperforms stochastics. Looking first at the buy signals from both indicators in late July, we can see that the stochastics is quicker out of the gate, providing an earlier entry into the trade. Unfortunately, that quick response also delivers a reversing sell signal in early August, very early in the bullish trend. In contrast, the TSI buy signal remains intact until near the end of the uptrend, reversing to a sell signal in mid-September. Following the first erroneous sell signal in early August, stochastics issues another three sell signals before finally getting it right in late September and capturing a modest gain to the downside. There's a good chance that, even with that eventual winner, the combination of those four sell signals would have resulted in a net loss. Finally, in mid- to late October, both oscillators issued fresh buy signals, and once again the stochastics was first to react with the same problem. Just as the uptrend is getting under way, stochastics becomes buried in overbought territory and ceases to be a useful tool, giving a sell signal just before the strong breakout over the $100 level. On the other hand, TSI issues its buy signal several days after stochastics, but remains in a strong bullish bias all the way to the right hand side of the chart, providing no lack of clarity. The superior utility of TSI is not limited to long-term charts. It can be just as easily used by intraday traders on short-term charts. In Figure 5, you see a two-day stretch in the trading action of Google (GOOG), 2004's hot IPO and subsequent momentum stock. With frequent $10-20 intraday moves, it has been a daytrader's paradise, but only if they are equipped with the right tools.
Figure 5: Intraday action. Even dialed down to short-term charts, the TSI continues to shine. Stochastics issued a buy signal early on November 11, well ahead of the corresponding buy signal on TSI, although both occurred very near the same price. Before the move had really gotten under way, stochastics had issued a reversing sell signal and was effectively done for the day. TSI remained steadily bullish throughout the session, offering a substantial gain by the close. On November 12, both oscillators issued early sell signals that remained valid into the final hour. The stochastics reversed to a late buy signal, while the TSI remained bearish. Gains from either tool would have been comparable on this day, but which do you think would have provided an easier ride?
proper perspectiveAs alluded to, I think it is dangerous to make trade decisions based on the action of a single indicator. Oscillators are an important tool for reading price action but cannot be reliably applied without some other studies as confirmation. The TSI is the closest thing I have seen to a standalone oscillator, and is an important component of my own trading decision process. However, it is only one piece of the puzzle, and I never use it in isolation. The TSI will not capture every wiggle on the chart, but that shouldn't be our goal as traders. We should endeavor to take healthy chunks from the middle of solid price moves, while avoiding being carved to pieces through taking too many ill-fated trades. In my experience, TSI accomplishes that goal better than any other oscillator I have tried. While oscillators like stochastics will offer earlier and more frequent trade signals, I hope I've shown here that fewer trade signals can actually translate into more profits. I'll be the first to admit that the search for the "perfect" indicator is a fruitless one. Every indicator created since the inception of technical analysis can be thrown into market conditions in which it will perform poorly. But the best indicators exhibit a high degree of robustness, performing well in most market conditions and minimizing false signals the rest of the time. Applied in conjunction with a few other tools, not the least of which is a sound money management plan, TSI can be a reliable component of a trader's arsenal, allowing for the methodical harvesting of more profits than are given back due to the inevitable losses.
Mark Phillips has traded commodities, currencies, stocks, options, and index futures since 1995. He is currently a staff writer at CoiledMarkets.com, an advisory and educational website for traders. He may be reached at mark@coiledmarkets.com.
suggested readingBlau, WIlliam [1991]. "True Strength Index," Technical Analysis of Stocks & Commodities, Volume 9: November._____ [1992]. "Trading With The True Strength Index," Technical Analysis of Stocks & Commodities, Volume 10: May. _____ [1995]. Momentum, Direction, And Divergence, John Wiley & Sons. TradeStation
Current and past articles from Working Money, The Investors' Magazine, can be found at Working-Money.com. |
| E-mail address: | mark@coiledmarkets.com |
PRINT THIS ARTICLE

Request Information From Our Sponsors
- VectorVest, Inc.
- Executive Premier Workshop
- One-Day Options Course
- OptionsPro
- Retirement Income Workshop
- Sure-Fire Trading Systems (VectorVest, Inc.)
- Trading as a Business Workshop
- VectorVest 7 EOD
- VectorVest 7 RealTime/IntraDay
- VectorVest AutoTester
- VectorVest Educational Services
- VectorVest OnLine
- VectorVest Options Analyzer
- VectorVest ProGraphics v6.0
- VectorVest ProTrader 7
- VectorVest RealTime Derby Tool
- VectorVest Simulator
- VectorVest Variator
- VectorVest Watchdog
- StockCharts.com, Inc.
- Candle Patterns
- Candlestick Charting Explained
- Intermarket Technical Analysis
- John Murphy on Chart Analysis
- John Murphy's Chart Pattern Recognition
- John Murphy's Market Message
- MurphyExplainsMarketAnalysis-Intermarket Analysis
- MurphyExplainsMarketAnalysis-Visual Analysis
- StockCharts.com
- Technical Analysis of the Financial Markets
- The Visual Investor

