HOT TOPICS LIST
- Strategies
- Stocks
- Buy
- Investing
- Brokers
- Psychology
- Interviews
- Accumulate
- Sell
- Hold
- Spotlight
- Websites
- Candlestick Corner
- Gold & Metals
- Options Trading
LIST OF TOPICS
INVESTING
Technical Analysis For The Masses
11/22/00 03:20:38 PM PSTby David Penn
From charts and breakouts to trends and moving averages, technical analysis offers average investors a window looking onto Wall Street.
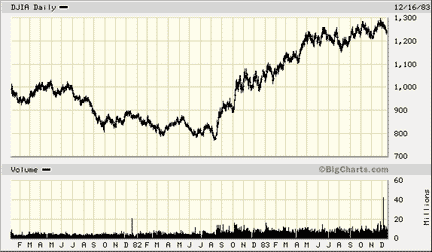
| Technical analysis? Head-and-shoulders formations?! Resistance line breakouts?! Stochastics?! And just how "technical" is this technical analysis stuff, anyway? Do I need a computer? A modem? A live-in electrical engineer with an MBA? What is technical analysis, anyway? Many people are surprised to learn that technical analysis is based on the same economic fundamentals we learned back in school: supply and demand. While technical analysis can be as complicated as its better-known relative, fundamental analysis, the basic principles of technical analysis could not be simpler: when supply is low and demand is high, prices rise. On the other side, when supply is high and demand is low, prices fall. When both supply and demand are low -- or high, for that matter -- prices tend to stay in a range, bobbing a little higher or little lower, but not moving too much in either direction. Got that? Congratulations! You are now a fully qualified technical analyst! Well, not quite. But if you keep the basics of supply and demand in mind as you continue to learn about technical analysis, you will find most technical analysis concepts easy to understand. In fact, don't be surprised if many ideas and strategies used by technical analysts sound as though they border on common sense after just a small amount of study. Although many 21st-century technical analysts use complex and powerful computer programs such as TradeStation, MetaStock, Window on Wall Street, and others to enhance their analyses, the foundations for technical analysis were laid many years ago by Charles Henry Dow -- 19th-century economist, founder and first editor of The Wall Street Journal, and father of technical analysis as we know it today. A NOT-SO-RANDOM WALK DOWN WALL STREET Charles Dow (and, yes, he is the one who put the "Dow" in "Dow Jones") never wrote a book about his seminal observations on the stock market. But his thoughts -- based on 15 years of watching and charting share price movements in the market -- were published as a series of articles in The Wall Street Journal in 1901. Dow realized that stock prices moved not so much by news reports on the facts about a company's prospects, but by the reaction to those facts (or even anticipation of those facts). This observation may seem self-evident in today's investing climate of online brokerages, real-time trading, and streaming stock quotes, but Dow's realization that the stock prices in the marketplace moved, essentially, on the hopes and fears of investors was a major breakthrough at the time, the implications of which are still being addressed today. What does it mean when we hear that stock prices move based on the actions of market participants, not based on the news? Basically, it means that the rules of the stock market are subjective. What appears to be good news -- for example, the announcement of a merger or a new chief executive officer -- may trigger different reactions for different market participants, and thus a number of different effects on the stock market. For an investor, news that is likely to result in a rise in the stock price may indeed be good news. After all, the investor is acquiring shares for long-term capital appreciation, and rising stock prices contribute toward that goal. However, a trader -- whose view on the market may be much more short term -- may see that same rise in stock price as a great opportunity to sell shares and make a profit. As far as Charles Dow was concerned, what would ultimately make the difference in whether the stock's price advanced (moved up) or declined (moved down) would be the relative strength of those who wanted to buy the stock -- thus creating demand and putting upward pressure on prices -- compared with the relative strength of those who wanted to sell the stock -- thus creating supply and putting downward pressure on prices. This classic struggle between the bulls (buyers) and the bears (sellers) exists in every marketplace and is nowhere more pronounced than in the stock market. When you hear economists say that the US economy has been in a bull market since 1992, they mean that the buying pressure for stocks has been greater than the selling pressure for stocks, overall, since 1992. In Figure 1, you can see the relationship between the average investor and the stock market; the bull market that began in 1982 saw a marked buying pressure that continued until October 1987, gaining 240%, or 1,800 points.
So stronger buyers means the price goes up, and stronger sellers means the price goes down. But what does this all mean for the individual investor who is looking to make money by buying stocks before they go up and selling them before they go down? In partial answer to this question, Charles Dow wrote that "pride of opinion caused the downfall of more men on Wall Street than all the other opinions put together." From this, we can infer that investors could profit by studying and following the trends of a stock's price -- which was little more than studying and following the attitudes of those buyers and sellers interested in the stock over time. The easiest way to follow price movements is with a chart. In fact, technical analysts are often distinguished from the pack of market watchers by their devotion to charts. So commonplace is the linking of technical analysis with charting that technical analysts are often referred to as "chartists." And while there may be some semantic differences -- all those who use technical analysis do not necessarily use charts heavily and all those who use charts are not necessarily technical analysts -- the linkage is powerful, and accurate, enough. Charts provide a range of information, from intraday charts that plot every tick in share price movement to long-term charts that show the movement of the Standard & Poor's 500 over the past 100 years. But the breadth and depth of information that charts can reveal is hard to beat. In fact, it is not an overstatement to suggest that anyone seeking to gain greater insight into the price movements of individual stocks, groups of stocks, or the market as a whole needs to make use of charts. In charts, technical analysts or chartists see patterns of human behavior -- specifically, the interaction of bulls and bears struggling to buy and sell stocks. Even the attitude of those not currently in the market is represented, often by volume bars at the bottom of a chart, which show the number of stocks being traded at any given time. Low volume or below-average volume, for instance, often indicates low trading interest in the stock, meaning a major price movement in one direction or the other is less likely than if volumes were large or at least above average.
Technical analysts follow a number of basic rules or assumptions. Many of these came from the work of Charles Dow; others were discovered by technically oriented market watchers, including W.D. Gann, Richard Wyckoff, and R.N. Elliot -- each of whom went on to create memorable technical analysis strategies to plot stock prices and anticipate reversals. However, the essential tenets of technical analysis remain much the same, regardless of the unique approaches of individual methods. The most important tenet is that the market discounts everything; anything that can be known about a stock is reflected in its price. In fact, this explanation can be extended to include not just known facts, but sentiments, attitudes, and opinions about a corporation's financial outlook as represented in its stock price. Because a stock price is not an objective statement, but is itself an opinion reached by the competing actions of buyers and sellers (bulls and bears, respectively), stock prices can and will move -- sometimes dramatically -- based on the way stock market investors and traders absorb information (from annual reports to Wall Street rumors to consumer campaigns). Second, but no less important, is the assumption that prices move in trends. This means the directions that prices take -- moving from higher to lower, lower to higher, or even oscillating in a narrow range -- can be seen as part of larger, overall price movements that are either advancing (bullish), declining (bearish), or more or less holding steady. This assumption is borne out of observation; it is very rare for a price to reach new highs, then retreat to new lows, then climb back to the highs again, only to fall back into the gutter. More often, a price will advance for a period, suffering occasional small-scale pullbacks and retreats, until some reversal takes place and the price declines for a period, with occasional upthrusts and smaller advances. It is this price movement behavior that the early technical analysts such as Charles Dow and Richard Wyckoff noted, behavior that hints at one of the most basic laws of physics: objects in motion tend to stay in motion. And powerful forces are necessary for an object at rest to begin moving, or for an object in motion to change direction. In the world of technical analysis, that object is price and those forces are supply and demand. When we speak of price, we are really speaking about psychology. And when we speak of price movement or price action, we are really referring to changes in the psychology of market participants. This basic psychology has changed little since shares of common stock were first made available to the investing (and speculating) public. When it comes to money, it seems as if human nature has changed the least. Primal emotions like fear, desire, greed, and despair seemed to affect people who were participating in the stock market of the 1940s and 1950s pretty much in the same way it affects people participating in This is where another of technical analysis' major tenets comes from, the assumption that history repeats itself. "History" is not meant in a rigid sense, as if to say when the market or a particular stock reaches point X, it will always do Y. Rather, by "history," we mean that people tend to respond the same way to different events -- whether it is a reaction to a hot, new industry group or an international oil crisis. CHARTING FOR GAINS AND PROFIT What can technical analysis of the stock market, various industry groups, and individual stocks do for the average investor with an IRA or a 401(k) wrapped around a mutual fund? Let us count the ways. For the average investor who makes regular or periodic deposits in his or her mutual fund, a study of the trends of that fund can help an investor make more sizable deposits when the fund is trending down (and shares in the fund are cheaper) and less sizable deposits when the fund is up. Investors who own more than one mutual fund can also benefit by using the tools of technical analysis to allocate and reallocate resources between their better- and worse-performing funds. Mutual fund investors interested in taking a more active role in their investments can use charts and other technical strategies to monitor the progress of the equity holdings within their mutual funds. An investor may be able to anticipate trouble with a stock (or several) in which his or her mutual fund is overweighted. If the technical prognosis is bad enough, an investor could switch to a mutual fund whose equity holdings he or she has studied and prefers. With the growth of online and discount brokerages, many more average investors have begun buying stock in a company or two as well as owning shares in a mutual fund. When fundamental analysis offers such helpful stock tips as "XYZ is trading at 14 times projected 2002 cash flow," the ability to look at a chart and form conclusions about a stock's progress in the short, intermediate, and even longer term can be a welcome relief. Not a few average investors who once paper-traded stocks with little more than a daily newspaper for research have become so enamored of technical analysis that they eventually took early retirement from the 9-to-5 world and started a second career trading equities for their own accounts! At the same time, learning about technical analysis can be fun and exciting in its own right. Behind the smoked-glass windows of Wall Street, the constant struggle between bulls and bears, buyers and sellers, "quick buck" traders and deep-pocketed institutional investors rages on. And no other study of the market gives average investors an insight to this world the way technical analysis does. Far from being a reading of tea leaves, technical analysis is more like a ringside seat at a prize fight. ROUND 2 And on that note, the next round of technical analysis for the masses will continue with the basic tools of the trade by introducing trendlines. In many ways, trendlines form the foundation of technical analysis, marking off regions where prices tend to advance or decline, helping investors and traders see through the raucous commotion of the stock market to reveal the powerful forces of bulls and bears in action. |
Technical Writer for Technical Analysis of STOCKS & COMMODITIES magazine, Working-Money.com, and Traders.com Advantage.
| Title: | Traders.com Technical Writer |
| Company: | Technical Analysis, Inc. |
| Address: | 4757 California Avenue SW |
| Seattle, WA 98116 | |
| Phone # for sales: | 206 938 0570 |
| Fax: | 206 938 1307 |
| Website: | www.traders.com |
| E-mail address: | DPenn@traders.com |
Traders' Resource Links | |
| Charting the Stock Market: The Wyckoff Method -- Books | |
| Working-Money.com -- Online Trading Services | |
| Traders.com Advantage -- Online Trading Services | |
| Technical Analysis of Stocks & Commodities -- Publications and Newsletters | |
| Working Money, at Working-Money.com -- Publications and Newsletters | |
| Traders.com Advantage -- Publications and Newsletters | |
| Professional Traders Starter Kit -- Software | |
PRINT THIS ARTICLE

Request Information From Our Sponsors
- StockCharts.com, Inc.
- Candle Patterns
- Candlestick Charting Explained
- Intermarket Technical Analysis
- John Murphy on Chart Analysis
- John Murphy's Chart Pattern Recognition
- John Murphy's Market Message
- MurphyExplainsMarketAnalysis-Intermarket Analysis
- MurphyExplainsMarketAnalysis-Visual Analysis
- StockCharts.com
- Technical Analysis of the Financial Markets
- The Visual Investor
- VectorVest, Inc.
- Executive Premier Workshop
- One-Day Options Course
- OptionsPro
- Retirement Income Workshop
- Sure-Fire Trading Systems (VectorVest, Inc.)
- Trading as a Business Workshop
- VectorVest 7 EOD
- VectorVest 7 RealTime/IntraDay
- VectorVest AutoTester
- VectorVest Educational Services
- VectorVest OnLine
- VectorVest Options Analyzer
- VectorVest ProGraphics v6.0
- VectorVest ProTrader 7
- VectorVest RealTime Derby Tool
- VectorVest Simulator
- VectorVest Variator
- VectorVest Watchdog


