HOT TOPICS LIST
- Strategies
- Stocks
- Buy
- Investing
- Brokers
- Psychology
- Interviews
- Accumulate
- Sell
- Hold
- Spotlight
- Websites
- Candlestick Corner
- Gold & Metals
- Options Trading
LIST OF TOPICS
FOCUS ON
The Count Right Now, Redux
04/20/05 12:40:58 PM PSTby David Penn
Truncated fifth or extended fifth? What can we make of the March highs?
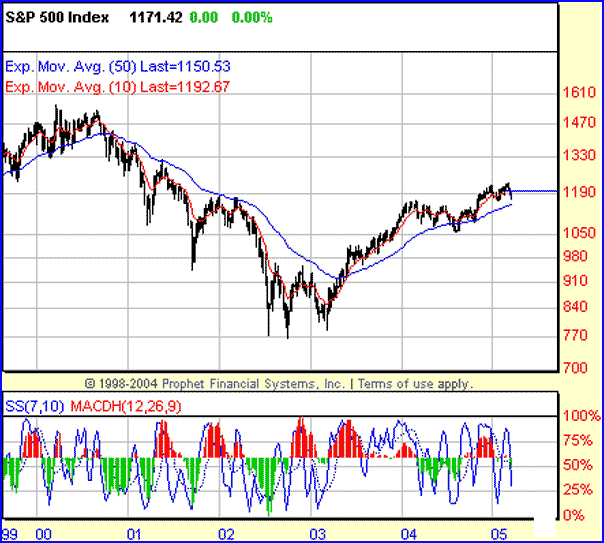
| Since this article was written in late March 2005, the S&P 500 has broken the January 2005 lows near the 1160 mark. This development only underscores the conclusions reached here: that the argument for a March top in the S&P 500 (the "pseudotruncation" argument) is stronger than the argument for significant new yearly highs in the S&P 500 (the "extension" argument). Nearly a month later, the analysis in the original article below remains valid. I still believe that the market (by which I mean the Standard & Poor's 500) could set a new high for the year before the cyclical bull market that began in 2002 is over. I've made this argument repeatedly in articles for Working Money and Traders.com Advantage and, as long as the January 2005 lows near the 1163 mark hold, I feel that view best respects the power of the bull market, even as it nears its 30th month of advances. After all, the fact remains that even after an especially tricky first quarter of 2005, the S&P 500 has largely remained above its 50-week exponential moving average (EMA). And the 50-week EMA is no mean zone of support. Consider that, as the cyclical bear market got under way back in the summer of 2000, sending the S&P 500 below its 50-week EMA, the S&P 500 did not close above that moving average on a weekly basis until late in the spring of 2003, nearly three years later. With regard to the cyclical bull market that began in the autumn of 2002, the S&P 500 managed to make its first weekly close above the 50-week EMA in May 2003 (at 930, by the way) and did not make a weekly close below that moving average until August 2004. At that time, there were two weekly closes below the 50-week EMA before the S&P 500 rallied again, closing back above the 50-week EMA shortly thereafter. The S&P 500 proceeded to make still higher highs for the cyclical bull market.
Figure 1: As this weekly chart of the S&P 500 shows, the 50-week exponential moving average (in blue) has been a reliable source of both resistance and support during the cyclical downturn in 2000 and since the cyclical upturn in 2003.
So fading the bull market in the S&P has not been without its potential perils. Nevertheless, responsible analysis requires me to consider other possibilities as well. And in the same way that I moved the wave 1 top forward from the September highs to the October highs ("From Zigzag To Triangle?" Traders.com Advantage, February 25, 2005) — albeit incorrectly in the view of at least one correspondent — it is worth considering whether the market topped with the highs in early March, as a number of bears (many of whom first believed that the market had topped in December) have been suggesting. From an Elliott wave perspective, a March top would mean that the five-wave movement up from the August lows has almost resulted in a failed or truncated fifth. While the March top did in fact close above the December highs, it did so in such a meek (read: bull trap) fashion that I thought it worthwhile to think of the March top in some ways as we do about truncated tops such as are found in truncated fifths. I suspect the psychology and market dynamics that create a truncated fifth aren't too far from the sort of psychology and market dynamics that create fifth wave tops that barely clear the previous third wave top. In any event, here are Robert Prechter and A.J. Frost, in their classic Elliott wave text, Elliott Wave Principle, discussing "failures":
Elliott used the word "failure" to describe a five-wave pattern of movement in which the fifth impulse wave fails to move above the end of the third. It can usually be verified by nothing that the presumed fifth wave contains the necessary five subwaves... Failures are not uncommon, especially in waves of small degree. Failures give warning of underlying weakness or strength in the market and tell us more about the reality of stock market life than most of us care to hear. Just when we think we have it all wrapped up in a neat Elliott package, along comes a failure to cut short our expected target.
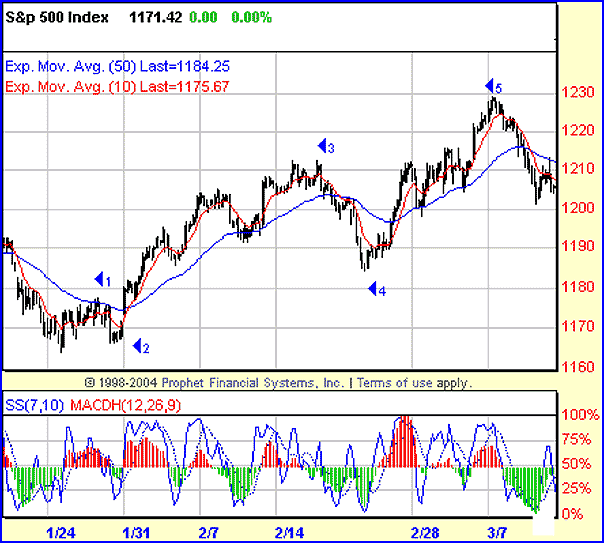
Let's look at the proposed fifth wave. The fifth wave appears to begin on January 25. The fact that many indexes (though not all) showed a positive stochastic divergence at that low suggests that a bottom of some significance occurred then. Channeling also supports the idea that this low marked the end of wave 4 (which began with the late December highs) and the beginning of wave 5 (see my "The S&P 500's Spring Channel Surfing," Traders.com Advantage, March 11, 2005, for more details about the old and new channels that have bounded the rally that began in August 2004.). I'll return to the channeling issue in just a moment. First, though, can we find a coherent five-wave pattern in the S&P 500's move from the January lows to the March highs? I believe so. That count — which is best seen in the hourly or 60-minute charts of the S&P 500 — would be more or less as follows:
Particularly impressive are the inner wave structures of wave 3 and wave 5.
Figure 2: A case can be made that this is the five-wave "lesser degree" structure leading up to the pseudotruncated fifth wave in early March 2005.
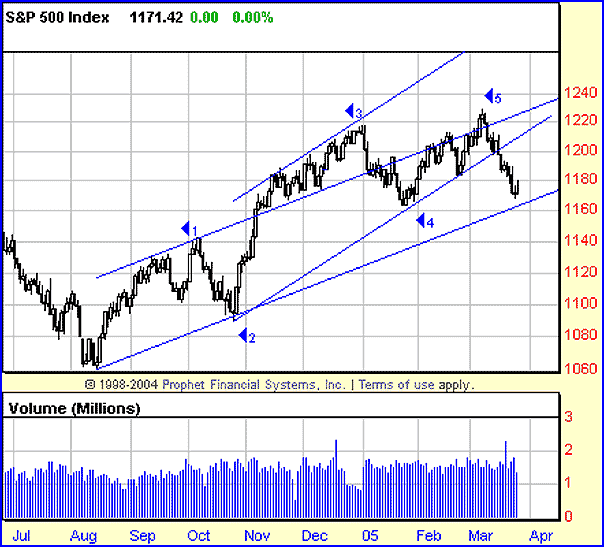
The channeling issue is an interesting one. As Prechter and Frost point out, there are instances in which a single trend channel will not contain the entire five-wave movement. In such cases, the "old channel," which is based on the wave 1 peak and the wave 2 trough, is revised into a "new channel," which is based on the wave 2 trough and the wave 3 peak. Prechter and Frost write: "As a wave nears completion, the line which connects the lows of waves two and four is the final and most reliable bottom parallel line for the final trend channel." This is precisely what has happened with the rally from the August 2004 lows. It is also precisely what makes the downside penetration of the "new channel" in March problematic — at least as far as a continuation of the rally is concerned. It is hard, verging on the impossible, to imagine a coherent wave count that would allow the S&P 500 to both take out the wave 4 low in late January and then rally to take out the early March high. But imagining new year-to-date highs in the wake of the mid-March downside break through the lower boundary of the "new channel" is not much easier.
Figure 3: Old channel meets new channel. The initial channel is based on the wave 1 peak and the wave 2 trough. Just as Prechter and Frost would have it, when the old channel was unable to contain the S&P 500's rally, a new channel based on the wave 3 peak and the wave 2 trough was formed.
In fact, the only way I can see this possibility is if the fifth wave that began in January is an extended one, with a lesser-degree wave 2 that essentially is a mirror copy of the previous, December-to-January wave 4. I would suggest that this thesis would represent the hyperbullish scenario. Why? Because it would not only provide for a 40-plus point lesser-degree first wave, but also comparably sized third and fifth waves. If the cycle bull market that began in 2002 is still likely to run out of steam before reaching the 1260 level (see my "Elliott Wave 2005," Working Money, January 12, 2005, for the details of that argument), then there simply isn't enough room. Let's pursue this a little more to be as clear as possible. In this scenario — in which wave 5 is an extended wave with a large, recognizable five-wave substructure within it — the March decline would represent a lesser-degree wave 2, a wave 2 that would have to find support at 1163 at the lowest. A lesser-degree third wave from this level would at least have to take out the early March highs (lesser-degree wave 1 peak). In addition, a lesser-degree fourth wave could not enter the price territory of the lesser-degree first wave — meaning that the lesser-degree fifth wave could not begin any lower than the lesser-degree wave 1 peak at about 1227. That would mean a lesser-degree wave 5 that could be no more than 33 points (again, to conform to the 1260 ceiling mentioned). And this is assuming a lesser-degree wave 5 that began at the lowest point possible (the lesser-degree wave 1 peak at 1227). So while this extended fifth scenario could take place, it doesn't appear to be the most likely outcome. It is also possible that the entirety of the 2005 price action in the S&P 500 is a fourth-wave correction, with the January decline representing a wave "a," the rally to the March top representing a wave "b," and the declines into late March a wave "c." This would make for a relatively conventional "flat," and would allow for the January lows to be penetrated by some moderate amountwith the October highs (the wave 1 highs) near 1140 becoming the "line in the sand" level. I'm not impressed by this argument for a few reasons — not the least of which is the fact that this would provide for a fairly long fourth wave (in terms of duration) of about three months, compared to the shorter durations of wave 3 (approximately two months) and wave 1 (just shy of two months) — to say nothing of wave 2. A complex fourth wave would make sense — given the relative simplicity of the wave 2 in October. And if the S&P 500 does find support at either the January 2005 lows or the lower boundary of the "old channel," then the "long 'n' complex fourth wave" argument would gain some traction — as would the argument of "extension" rather than "truncation" — or rather, the pseudotruncation of a bull trap top. At the same time, a rally from those support levels that met topped at the 1220 level would set up a bearish long- to intermediate-term head and shoulders top in the S&P 500, one with measurement implications as low as 1100. So which argument ultimately is the most persuasive? Not only is it probably too soon to make that call, but also it isn't a call that needs to be made at this point. From a pure trader's perspective, the S&P 500 is quite oversold in late March — even as the 7,10 stochastic has yet to make a lower low relative to the low stochastic levels back in January. As such, a bounce is probably more than a little overdue. However, should the market not provide that bounce, traders and analysts should keep an eye on the lower boundary of the "old channel," which extends to about the 1160 level. Should the S&P 500 take out potential support at the lower boundary of the "old channel," then the argument for "pseudotruncation" (over "extension") will be all the more difficult to deny.
David Penn may be reached at DPenn@Traders.com.
SUGGESTED READINGELWAVE User Manual, Prognosis Software Development Current and past articles from Working Money, The Investors' Magazine, can be found at Working-Money.com.
|
Technical Writer for Technical Analysis of STOCKS & COMMODITIES magazine, Working-Money.com, and Traders.com Advantage.
| Title: | Traders.com Technical Writer |
| Company: | Technical Analysis, Inc. |
| Address: | 4757 California Avenue SW |
| Seattle, WA 98116 | |
| Phone # for sales: | 206 938 0570 |
| Fax: | 206 938 1307 |
| Website: | www.traders.com |
| E-mail address: | DPenn@traders.com |
Traders' Resource Links | |
| Charting the Stock Market: The Wyckoff Method -- Books | |
| Working-Money.com -- Online Trading Services | |
| Traders.com Advantage -- Online Trading Services | |
| Technical Analysis of Stocks & Commodities -- Publications and Newsletters | |
| Working Money, at Working-Money.com -- Publications and Newsletters | |
| Traders.com Advantage -- Publications and Newsletters | |
| Professional Traders Starter Kit -- Software | |
PRINT THIS ARTICLE

Request Information From Our Sponsors
- StockCharts.com, Inc.
- Candle Patterns
- Candlestick Charting Explained
- Intermarket Technical Analysis
- John Murphy on Chart Analysis
- John Murphy's Chart Pattern Recognition
- John Murphy's Market Message
- MurphyExplainsMarketAnalysis-Intermarket Analysis
- MurphyExplainsMarketAnalysis-Visual Analysis
- StockCharts.com
- Technical Analysis of the Financial Markets
- The Visual Investor
- VectorVest, Inc.
- Executive Premier Workshop
- One-Day Options Course
- OptionsPro
- Retirement Income Workshop
- Sure-Fire Trading Systems (VectorVest, Inc.)
- Trading as a Business Workshop
- VectorVest 7 EOD
- VectorVest 7 RealTime/IntraDay
- VectorVest AutoTester
- VectorVest Educational Services
- VectorVest OnLine
- VectorVest Options Analyzer
- VectorVest ProGraphics v6.0
- VectorVest ProTrader 7
- VectorVest RealTime Derby Tool
- VectorVest Simulator
- VectorVest Variator
- VectorVest Watchdog


