HOT TOPICS LIST
- Strategies
- Stocks
- Buy
- Investing
- Brokers
- Psychology
- Interviews
- Accumulate
- Sell
- Hold
- Spotlight
- Websites
- Candlestick Corner
- Gold & Metals
- Options Trading
LIST OF TOPICS
TRADER'S NOTEBOOK
Bull Call vs. Bull Put Spread (CME#9)
05/02/05 10:28:05 AM PSTby Rudy Teseo
Is a credit spread a better strategy than a debit spread just by reason of the credit?
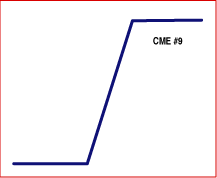
It's impossible to tell whether a credit spread is better than a debit spread without a detailed examination of the two strategies and a little reward/risk (R/R) analysis. First, let's examine the diagram in Figure 1 to better understand its significance, and how it will help you analyze what's happening to your strategy as the price of the underlying instrument changes. The "CME#9" in the diagram title refers to diagram 9 in the Chicago Mercantile Exchange (CME) booklet of 21 proven strategies for option trading. (It's available free of charge; check at the end of this article at the references section.)
The diagram is one of the standard profit/loss curves used to analyze the changing option price with the passage of time and the changing underlying market price. The diagram is a symbol of the actual curve you will see if you are doing your analysis in a Black-Scholes model, such as the Options Toolbox available from the Chicago Board Options Exchange (CBOE). (See my article on using this model in the March 2000 STOCKS & COMMODITIES.) BULL SPREAD
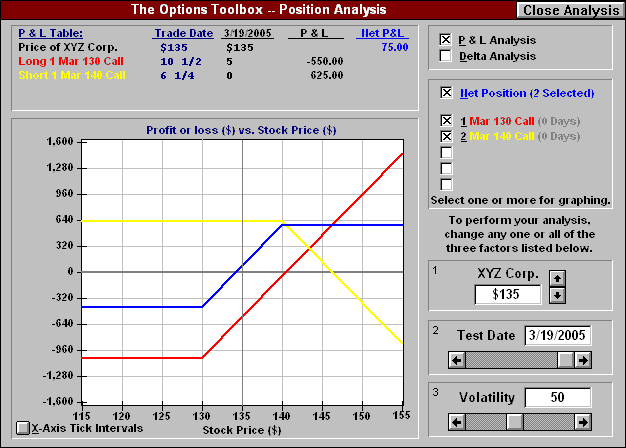
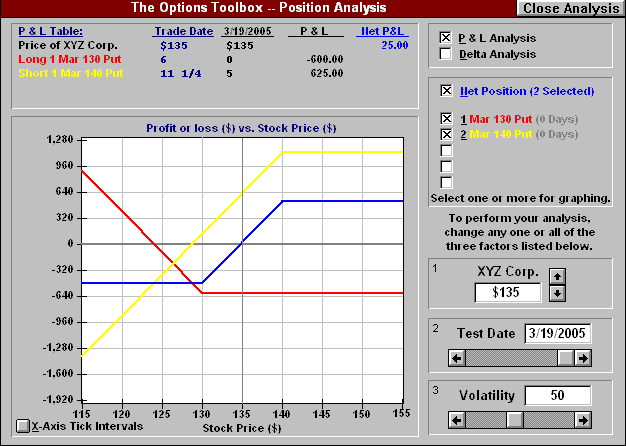
Figure 2 shows the derivation of the bull call spread curve (blue). The red curve is the long call with the break at the 130 strike price; the yellow curve is the short call at the 140 strike price. Again, these are the standard symbols for these strategies, which are always shown at expiration. At any time prior to expiration, these curves do actually curve. Figure 3 shows a screen shot of the model analyzing a bull put spread. Note the blue spread curve is identical to that of the bull call spread; however, this time the red curve is the long put and the yellow is the short put.
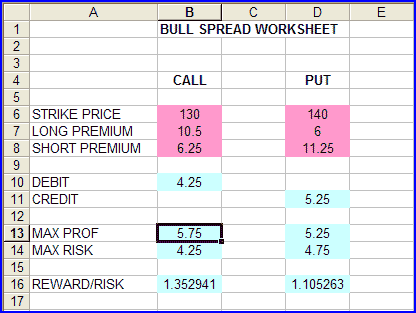
LET'S ANALYZE THIS Put Spread So even though the call spread started out as a debit, its R/R is greater than the put (credit) spread. This is not always the case, however, which is why each strategy must be evaluated in this way. Volatility is the culprit here, as the premium price you actually pay (or receive) may not agree with what the model tells you it should be. When using the model, you must plug in the actual market price if it differs from the calculated price. This same analysis applies to bear call and bear put spreads, and the same analysis is required. However, in the bear strategy, the call is the credit spread and the put is the debit spread. Try it! In Figure 4, you see an Excel spreadsheet model that will do all the calculations for you.
Type in your variable data (strike prices and option premiums) in the pink cells, and the results will be displayed in the green cells. The formulas for the cells are as follows: B10 = B7 - B8 So which spread will it be? Going through with this simple reward/risk calculation will help you answer that question before you place that next options trade. Rudy Teseo is a private investor and has taught classes in option trading and technical analysis. He can be reached at RFTess@Juno.com. SUGGESTED READING Current and past articles from Working Money, The Investors' Magazine, can be found at Working-Money.com. |
Rudy Teseo is a private investor who trades stocks, options, and currencies. He has taught classes in technical analysis and option trading. He may be reached at rftess@optonline.net.
| E-mail address: | rftess@optonline.net |
PRINT THIS ARTICLE

Request Information From Our Sponsors
- StockCharts.com, Inc.
- Candle Patterns
- Candlestick Charting Explained
- Intermarket Technical Analysis
- John Murphy on Chart Analysis
- John Murphy's Chart Pattern Recognition
- John Murphy's Market Message
- MurphyExplainsMarketAnalysis-Intermarket Analysis
- MurphyExplainsMarketAnalysis-Visual Analysis
- StockCharts.com
- Technical Analysis of the Financial Markets
- The Visual Investor
- VectorVest, Inc.
- Executive Premier Workshop
- One-Day Options Course
- OptionsPro
- Retirement Income Workshop
- Sure-Fire Trading Systems (VectorVest, Inc.)
- Trading as a Business Workshop
- VectorVest 7 EOD
- VectorVest 7 RealTime/IntraDay
- VectorVest AutoTester
- VectorVest Educational Services
- VectorVest OnLine
- VectorVest Options Analyzer
- VectorVest ProGraphics v6.0
- VectorVest ProTrader 7
- VectorVest RealTime Derby Tool
- VectorVest Simulator
- VectorVest Variator
- VectorVest Watchdog


