HOT TOPICS LIST
- Strategies
- Stocks
- Buy
- Investing
- Brokers
- Psychology
- Interviews
- Accumulate
- Sell
- Hold
- Spotlight
- Websites
- Candlestick Corner
- Gold & Metals
- Options Trading
LIST OF TOPICS
MARKET UPDATE
The Role Of Gold
05/04/05 11:17:56 AM PSTby David Penn
What are gold and gold shares telling traders and investors about the current environment?
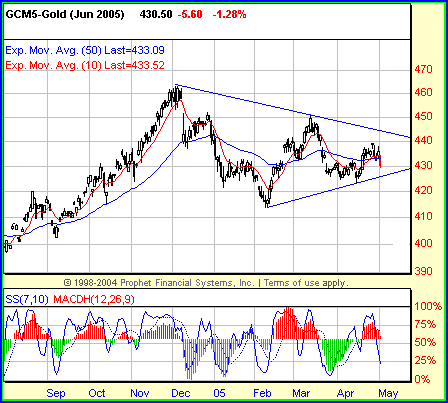
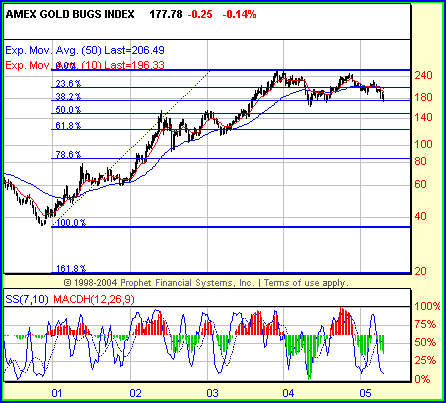
In the preface to his 1991 classic, Intermarket Technical Analysis, author, trader, and analyst John J. Murphy observes of intermarket technical analysis:The simple observation that commodity prices and bond yields trend in the same direction provided the initial insight that there was a lot more information to be got from our price charts, and that insight opened the door to my intermarket journey ... The results of that research confirmed what I was seeing on my charts -- namely, that commodities, bonds and stocks are closely linked, and that a thorough analysis of one should include consideration of the two. Nothing has changed since Murphy's key observation 14 years ago that the major asset groups have a relationship with each other, and understanding those relationships is key to understanding not only opportunities for trading and investment, but also for the sorts of macrolevel financial and economic issues that shape the political discourse of the world. What is also key in Murphy's observation is that a simple price chart can tell a trader more about the economic environment than all the statistical modeling championed by mainstream economists -- whether they are in the government, in academia, or in the private sector. Moreover, price charts -- unlike statistical models -- are far more difficult to manipulate, making it easier for technical analysts looking at intermarket relationships to review and contrast notes in true apples-to-apples comparisons. That is the spirit of this examination into the price charts of gold and gold stocks, oil and oil stocks, the 10-year Treasury note and the US dollar. Comparing what we see in black and white in the price charts to the received wisdom on inflation and deflation, interest rates, and other economic phenomena will go a long way toward helping traders and investors separate the reality from the rhetoric. GOING ... GOING ... GOLD? This is a logical place to start because of the key role played by the gold market in intermarket analysis. To briefly recap some points made earlier regarding the importance of gold, the gold market usually trends in the opposite direction of the US dollar; the gold market is a leading indicator of the CRB Index; gold is viewed as a leading indicator of inflation; gold is also viewed as a safe haven in times of political and financial turmoil. The dominant technical feature of the daily chart going back to at least the spring of 2004 when gold was tapping $375 is the November top between $450 and $460. This top, in fact, comes at the end of a bull run that extends far back beyond the spring of 2004. In fact, the latest that this bull market in gold began was probably the spring of 2001--back when gold was trading closer to $275 an ounce. By any estimation, that is an incredible run over the past three years. But not unlike the stock market's multiyear run from the lows in the autumn of 2002 to the highs in earliest 2005, the gold market has become demonstrably softer in the months since the autumn of 2004. The biggest worry for gold investors was the inability of the rally that began in January 2005 to take out the November 2004 multiyear highs. The truth is that those November highs weren't ever really tested by the 2005 rally, and that inability suggests that the bulls in gold might be weaker than many may care to believe.
True, the declines into March did not set a new low for the year in gold. But unless the rally that began in mid-March and continued into April sets a new high vis-á-vis mid-March, gold will have established a decidedly bearish pattern of two consecutively lower highs since November 2004. At that point, all that will remain is a test of the February lows near $410. Given that technical portrait, the anxieties of many a gold bug are easy to understand. While many gold bugs insist that sentiment is against them, the fact that of the gold bull market that has been in effect for years -- a bull market, as I've already noted, that has brought the price of gold up from $275 in 2001 to over $460 in 2004 -- argues against the notion that buying gold at its current levels (near $435 in late April 2005) represents a contrarian play against a tidal wave of bearish gold sentiment. GOLDEN BULLS AND INFLATION Some of these kinds of arguments and more are part of the basic vocabulary of the gold bull. In his recent article, "Gold Darkness Before The Dawn," Nelson Hultberg combines a variety of analytic tools to ask, "How possibly can gold remain at $400 with all this [social and economic unrest] on the horizon? Gold is going to go to where it has to in order to balance the economic books. I would say $2,000 [per ounce] is quite realistic in the next 10 years." Another author, David Vaughn, is no less bullish, approvingly citing the conclusions of GFMS, an independent London research group, which recently said that: ... [W]ith the twin US deficits marching toward unchecked, dollar weakness and, eventually, a sharp slowdown in the US economy are distinct possibilities. Ally that with an event-driven rally in the oil price, THEN GOLD HEADING FOR THE $500 MARK NO LONGER LOOKS FANCIFUL." Vaughn also notes the researchers as assuring that the "down side [to gold] is quite restrained." What is key in the analysis of most gold bulls is a nearly perfect combination of dollar depreciation and "world-going-to-hell-in-a-handbasket." Just what is in this handbasket depends on whom you ask: geopolitical uncertainties in Iraq, Iran, North Korea, the Sudan, between China and Japan, China and Taiwan, India and Pakistan; the once-and-forever War on Terror in its various anti-US, anti-Russia, and anti-Israel manifestations ... The list is long. Regardless of whatever is added or subtracted from this list of real and apparent geopolitical dangers, one constant is the fear of inflation -- a fear that, however often well-founded, is virtually perennial among gold/commodity bugs and sound money advocates. Writes Jim Puplava of Financial Sense: Pick up a newspaper, go to the grocery store, fill your tank with gasoline, look at your property tax bill, visit your doctor, or try to purchase a new home and you are faced with the grim reality of inflation. From cab fares to airfares, from department and grocery stores to filling stations, or a night at the movies, rising costs are all around us. This is not your father's inflation, either. Rather, it is an especially pernicious variety born out of the country's -- and the world's -- efforts to reflate themselves out of recession and debt into a world of self-sustaining growth and prosperity. Puplava continues: The only problem to this whole scheme is that the huge debt burden that now weighs over the economy and financial markets could create a deflationary debt crisis that must be inflated away. Its only antidote is coordinated reflation by central banks of the world's large developed economies. This is what we are now seeing. But what the gold bulls really have going for them is the "optimism" of a bull market that is longer than the one that has propelled many stock market analysts to new heights of bullishness in late 2004. (I put "optimism" in quotes because for the gold bull's "optimism" looks like pessimism everywhere else. See "hell in a handbasket.") In fact, it could be argued that gold bulls are mistaking the bull market in their rear-view mirror for the one they think they see on the other side of their windshield. After all, the gold market bottomed in the spring of 2001 and has been advancing ever since. By contrast, stocks bottomed in the autumn of 2002 -- a year and a half later -- suffered through a bear market for much of 2004, and distinctly appear to have peaked in the spring of 2005. While off its highs, gold still provides a more bullish-looking chart than do stocks. While gold -- basis continuous futures -- is exhibiting negative divergences at both the weekly and monthly levels at present, it is also true that such divergences in the recent past -- including the first few months of 2003 and the first few months of 2004 -- have led to reversals in the price of gold in the neighborhood of $40-50 per ounce. Significant setbacks, to be sure, but hardly the stuff of gold bear markets. Right? GOLD AND GOLD STOCKS And the price action of these gold stocks may be quite instructive. As Murphy noted in Intermarket Technical Analysis: One of the key premises of intermarket analysis is the need to look to related markets for clues. Nowhere is that more evident than in the relationship between the price of gold itself and gold mining shares. As a rule, They both trend in the same direction. When they begin to diverge from one another, an early warning sign is being given that the trend may be changing. Usually one will lead the other at important turning points ... It may be surprising to learn, then, that gold mining shares usually lead the price of gold. While this is not always the case (Murphy points out that gold peaked first in 1980 and again in 1986), Murphy's observation is nonetheless as helpful for speculators in gold and gold stocks as Dow theory is for speculator and investors in common stocks. While the technical merits of the gold market appear strong, the question might be: But are the gold shares enjoying similar strength? Or have they already begun to diverge from the yellow metal with which these stocks usually trend? Here's where things get problematic for gold bulls. Looking at a weekly chart of the index of unhedged gold stocks (the $HUI), it is clear that shares of gold mining companies topped in early December 2003. The $HUI fell below its 50-week exponential moving average (EMA) during the late spring and early summer of 2004, rallied above that level in the autumn of 2004 (along with the rising market for non-gold stocks), and then fell back below the 50-week EMA early in 2005. Clearly there is a strong -- and perhaps growing -- divergence between gold and gold shares. As I mentioned earlier in describing the technical portrait of gold, it is arguable that gold topped in December 2004 -- fully one year after gold shares appear to have topped. And while gold showed weakness in the first half of 2004 as gold shares did, gold was able to rally and set a new high while gold shares clearly failed to do so. It is certainly possible for the contraction that gold has shown in 2005 -- a contraction/consolidation featuring higher lows and lower highs since the peak in early December -- to produce an explosion in price to the upside. This possibility lies within all contractions and consolidations in trends. In fact, it could be argued that further upside is the more likely technical outcome of gold's 2005 contraction. But the action in the gold shares should give pause to those who believe sustainable higher gold prices are a slam-dunk. Unless and until gold shares (as measured by the $HUI -- or the $XAU, for that matter) are able to move back above their 50-week EMA -- a moving average that provided reliable support during the $HUI's advance from the 50s in spring 2001 to more than 250 in December 2003 -- it is the upside, not the downside of gold that appears "quite restrained." GOLD AND DEFLATION The smart-alecky answer is, of course, a cyclical bear market. And by some accounts, the $HUI has already discovered it. Looking at a Fibonacci retracement of the bull market in the $HUI since late 2000, we can see that the $HUI retraced 38.2% of the advance during the first leg of its post-December 2003 correction. After bouncing back over the second half of 2004, the $HUI again appears headed for a rendezvous with the 38.2% retracement level. Should the $HUI penetrate the 38.2% level and continue to move lower, there appears to be a good potential for support between the 50% and 61.8% retracement levels (roughly 144 and 118 on the $HUI). This support consists of the consolidation range that gold shares meandered through for much of 2002 and into 2003 before breaking out again in summer 2003.
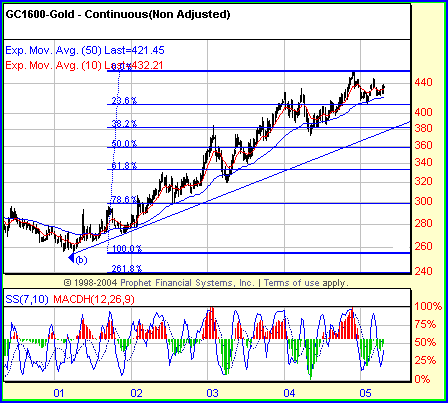
How do the retracements of gold compare? Assuming that gold topped in December 2004, a 38.2% retracement would take gold back to the $380 level. There is a good amount of support at this level -- also created from a consolidation range -- that could stem any decline in gold much as the $HUI's initial correction was stemmed at the 38.2% level. The 50% and 61.8% retracement levels are at $356 and $332, respectively, and could be the next levels of support should gold correct to and not be supported by the 38.2% retracement level.
Would falling gold prices of this magnitude renew cries of deflation -- the contraction of the money supply and simultaneous appreciation of the greenback? It's worth noting that the last big deflation scare in 2002 occurred when gold prices were significantly lower (gold spent 2002 trying to climb above $330). But the question here is relative. Would a drop from $450 to $350 or lower be more deflation-inducing (or, perhaps, deflation fear-inducing) than the drop from $320 to $260 between 1999 and 2001? Writing about deflation as it relates to a falling gold price, author and political economist Jude Wanniski observed years ago that: It is our understanding of classical, supply-side economics that inflation is defined as a decline in the monetary standard evidenced by a rising price of gold and that deflation is a decline in the monetary standard characterized by a falling gold price. In other words, gold moves first and all other prices follow over time. Of course, as we now know, often it is gold shares that moves first. But Wanniski's larger point remains valid. In an essay titled "The Deflation Monster," which in 2001 anticipated and summarized the nation's first bout with deflation in nearly 20 years, he wrote: Inflation hawks, of course, will deny that deflation is possible while the CPI ekes up and various money supply indices bulge like mattresses in a banking crisis. The CPI was also registering "inflation" during the 1981-83 deflationary squeeze, as it is today. Then, the indices were still being driven up by the previous inflation and had not yet fully reacted to the dollar/gold price. Because contracts can take decades to unwind, this process is gradual. It is worth noting that the price of gold was actually already starting to rise, just as people like Wanniski were finally getting policymakers to pay attention to the threat of deflation in early 2002. Where does this leave investors and speculators in gold and gold shares? While the gold market remains buoyant, the deterioration in the health of gold mining stocks is a warning sign that gold's bull market may be flagging. And the degree of correction that gold undergoes will likely provide a clear sign of just how close the economy is to once again slipping into a deflation that only a few suspect is even possible. David Penn may be reached at DPenn@Traders.com. SUGGESTED READING Current and past articles from Working Money, The Investors' Magazine, can be found at Working-Money.com. |
Technical Writer for Technical Analysis of STOCKS & COMMODITIES magazine, Working-Money.com, and Traders.com Advantage.
| Title: | Traders.com Technical Writer |
| Company: | Technical Analysis, Inc. |
| Address: | 4757 California Avenue SW |
| Seattle, WA 98116 | |
| Phone # for sales: | 206 938 0570 |
| Fax: | 206 938 1307 |
| Website: | www.traders.com |
| E-mail address: | DPenn@traders.com |
Traders' Resource Links | |
| Charting the Stock Market: The Wyckoff Method -- Books | |
| Working-Money.com -- Online Trading Services | |
| Traders.com Advantage -- Online Trading Services | |
| Technical Analysis of Stocks & Commodities -- Publications and Newsletters | |
| Working Money, at Working-Money.com -- Publications and Newsletters | |
| Traders.com Advantage -- Publications and Newsletters | |
| Professional Traders Starter Kit -- Software | |
PRINT THIS ARTICLE

Request Information From Our Sponsors
- StockCharts.com, Inc.
- Candle Patterns
- Candlestick Charting Explained
- Intermarket Technical Analysis
- John Murphy on Chart Analysis
- John Murphy's Chart Pattern Recognition
- John Murphy's Market Message
- MurphyExplainsMarketAnalysis-Intermarket Analysis
- MurphyExplainsMarketAnalysis-Visual Analysis
- StockCharts.com
- Technical Analysis of the Financial Markets
- The Visual Investor
- VectorVest, Inc.
- Executive Premier Workshop
- One-Day Options Course
- OptionsPro
- Retirement Income Workshop
- Sure-Fire Trading Systems (VectorVest, Inc.)
- Trading as a Business Workshop
- VectorVest 7 EOD
- VectorVest 7 RealTime/IntraDay
- VectorVest AutoTester
- VectorVest Educational Services
- VectorVest OnLine
- VectorVest Options Analyzer
- VectorVest ProGraphics v6.0
- VectorVest ProTrader 7
- VectorVest RealTime Derby Tool
- VectorVest Simulator
- VectorVest Variator
- VectorVest Watchdog


