HOT TOPICS LIST
- Strategies
- Stocks
- Buy
- Investing
- Brokers
- Psychology
- Interviews
- Accumulate
- Sell
- Hold
- Spotlight
- Websites
- Candlestick Corner
- Gold & Metals
- Options Trading
LIST OF TOPICS
THE CHARTIST
May Price And Volume Be With You
05/06/05 11:32:30 AM PSTby Tim Ord
The relationship between price and volume is key to trading profitably. Here's an in-depth look.
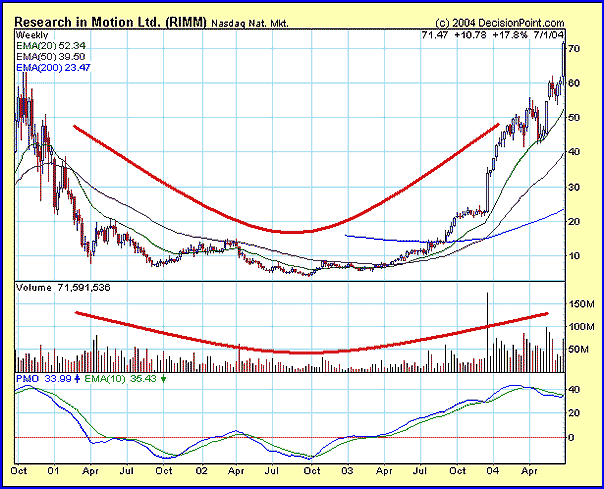
| Over the years, I have discovered that one of the best and most accurate tools in trading is the relationship between price and volume. I wrote an article in May 2004 for STOCKS & COMMODITIES that described how stocks and indexes react to previous highs and lows and what volume does to determine if that issue will reverse or rally through these support and resistance zones. The methods I discussed had a very high degree of success. Since they are one of the ways I analyze the markets, I decided to take a more in-depth look at price and volume relationships. SUPPLY AND DEMAND Take a look at a graph of Research In Motion (RIMM) in Figure 1. Note the supply (high-volume selling pressure) starting near $60 in late 1999 and gradually decreasing into the low of October 2002 close to the $4 range. As the stock price of RIMM was approaching the $4 low, supply weakened, suggesting that the low was nearing. Starting from the low in October 2002, demand (high-volume buying pressure) overtook supply and rallied strongly into April 2004. The high-volume down leg on RIMM confirmed the decline from $60 in 2000 to about $4 in October 2002. The gradual rally from $4 (October 2002) to $70 in April 2004 with gradually increasing volume confirmed the uptrend. You can see high-volume confirming price trend. Price can't go far (either up or down) without volume confirming that direction.
Figure 1: SUPPLY VS. DEMAND. The high selling pressure that brought the stock price down from the $50 range to $4 shows that supply has overtaken demand. The opposite happens when prices rise from $4 to $70.
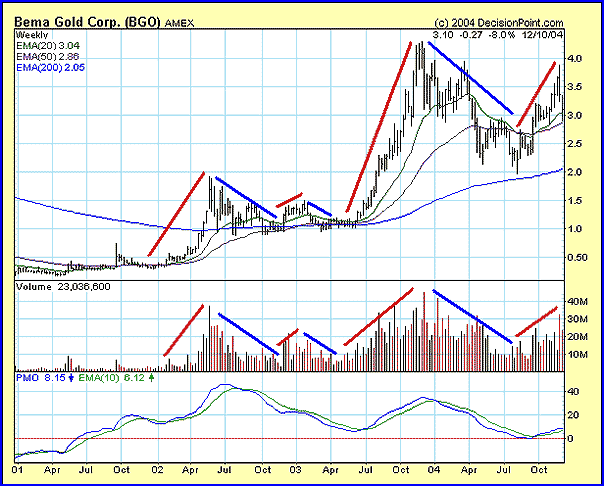
Bema Gold (BGO) By measuring the volume between the swings and comparing it to previous swings, you can see the force of a particular move developing in the stock. In an uptrend, the stock should have higher volume on the rally phase than the correction phase. In a downtrend, the stock should have higher volume on the declining phase than the up correction phase.
Figure 2: PRICE VS. VOLUME. Here you see how price increases are accompanied by increasing volume and price declines are accompanied by declining volumes. This suggests that the trend is in a bull mode
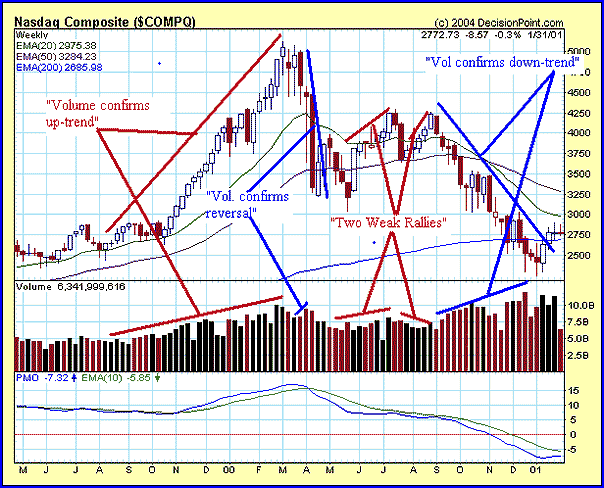
The Nasdaq Composite weekly index ($COMPQ) An interesting development occurred on the decline from late March to April 2000: Volume expanded during that decline. Since volume goes in the direction of the true trend, this high-volume decline suggested that the energy (force) had switched from up to down, implying the bull market had ended. After the April 2000 bottom, the Nasdaq made two feeble attempts to rally, but both rallies had weak volume and suggested the rally was not going far. Another decline started in September 2000, and you can see volume expanding as the decline progressed, confirming the downtrend. It takes practice to eyeball the rally phases and decline phases and match them with volume expansions and contractions to determine what direction the markets are really headed.
Figure 3: MARKETS DIRECTION. Getting adept at visualizing volume and price relationships can help you "eyeball" market reversal points.
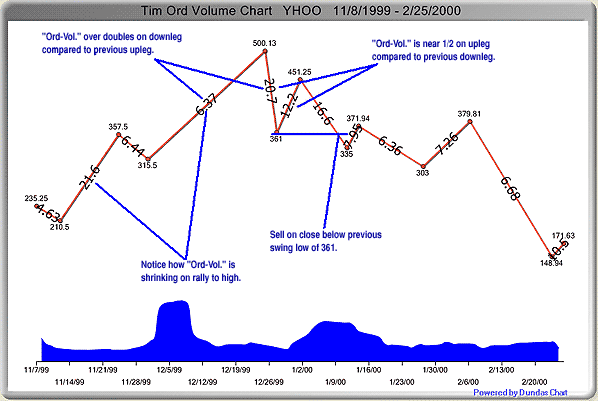
To identify trends in the market, I pick out the swings (on stocks or indexes) and then measure the force between the swings. When I say force, I mean the amount of "average volume between the swings." By measuring the average volume between the swings and comparing it to previous swings, you can see the force of a particular move developing. In an uptrend, the stock should have higher force on the rally phase than the correction phase. In a downtrend, the stock should have higher force on the declining phase than the up correction phase. To ascertain the average daily volume in a swing, add the volume between the swing high and low and divide by the number of days in the swing. This helps determine the force in that swing. You would then have to repeat the process with other swings and make a comparison with the other swings to find out which way the force is pushing. To make what can be a tedious process easier, I developed a software program to measure the average volume between swings. Now, with a single mouse-click, I can see the force behind a stock and which way that force is pushing. TRADING RULES
·To pick the strongest stock (in an uptrend), average daily volume should shrink close to 50% during a correction phase compared with the rally phase. Target price projections A downside target after a sell signal will be the previous "swing low." If volume is equal to or greater than the previous "swing low," then the next lower swing will be the target and so on. PATTERNS LEADING TO BUY SIGNALS
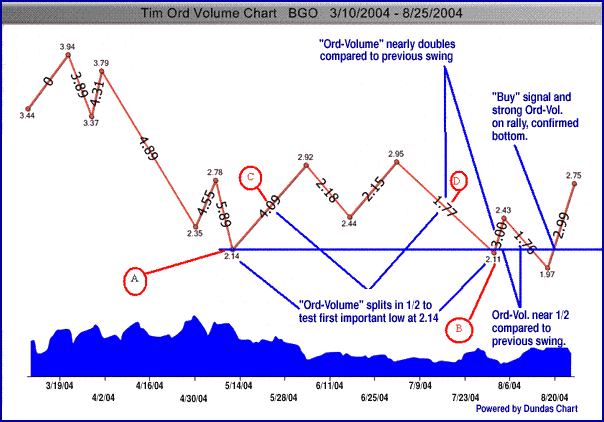
A bullish setup for BGO: In the rally from B to 2.43, you saw a twofold increase in volume and the decline from 2.43 down to the final low of 1.97 had half the volume of the previous rally. The buy signal comes at a close above the previous low of 2.11.
Figure 4: THE FORCE IS WEAKENING. A buy signal together with a strong Ord-volume on a rally confirmed the bottom. PATTERNS LEADING TO SELL SIGNALS
Figure 5: THE FORCE IS STRENGTHENING. An increased force to the downside indicated the rally had come to an end. Since the Ord-volume is about half of the previous downleg, a sell signal is triggered.
As you can see from these examples, volume is an important ingredient to determine direction of any tradable. One of the most accurate tools in trading is the relationship of price and volume, and to understand it is to be able to improve your trading. It is clear that the two forces work together; price can't go far, either up or down, without volume confirming the direction. Like the forces of the Jedi and the Dark Side, one must balance the other. May the forces of supply and demand be with you!
Tim Ord may be reached at www.ord-oracle.com.
SUGGESTED READING
Definitions
Current and past articles from Working Money, The Investors' Magazine, can be found at Working-Money.com.
|
| Company: | The Ord Oracle |
| Address: | 16928 Van Dorn |
| Walton, NE 68461 | |
| Phone # for sales: | 402-486-0362 |
| Fax: | 402-486-0390 |
| Website: | www.ord-oracle.com |
| E-mail address: | tim@ord-oracle.com |
Traders' Resource Links | |
| The Ord Oracle Market Letter & Ord Volume Software -- Advisory Services | |
| Ord-Volume software -- Software | |
PRINT THIS ARTICLE

Request Information From Our Sponsors
- VectorVest, Inc.
- Executive Premier Workshop
- One-Day Options Course
- OptionsPro
- Retirement Income Workshop
- Sure-Fire Trading Systems (VectorVest, Inc.)
- Trading as a Business Workshop
- VectorVest 7 EOD
- VectorVest 7 RealTime/IntraDay
- VectorVest AutoTester
- VectorVest Educational Services
- VectorVest OnLine
- VectorVest Options Analyzer
- VectorVest ProGraphics v6.0
- VectorVest ProTrader 7
- VectorVest RealTime Derby Tool
- VectorVest Simulator
- VectorVest Variator
- VectorVest Watchdog
- StockCharts.com, Inc.
- Candle Patterns
- Candlestick Charting Explained
- Intermarket Technical Analysis
- John Murphy on Chart Analysis
- John Murphy's Chart Pattern Recognition
- John Murphy's Market Message
- MurphyExplainsMarketAnalysis-Intermarket Analysis
- MurphyExplainsMarketAnalysis-Visual Analysis
- StockCharts.com
- Technical Analysis of the Financial Markets
- The Visual Investor

