HOT TOPICS LIST
- Strategies
- Stocks
- Buy
- Investing
- Brokers
- Psychology
- Interviews
- Accumulate
- Sell
- Hold
- Spotlight
- Websites
- Candlestick Corner
- Gold & Metals
- Options Trading
LIST OF TOPICS
TRADER'S NOTEBOOK
Pinpointing Volatility Dynamics
05/11/05 03:04:38 PM PSTby Lisa Erdmier
What exactly is volatility and how can we use it?
| Volatility has been the keyword in today's markets. Its meaning varies depending on your perspective, but after a volatile trading day, most traders feel whipsawed, as though the trading day seemed like six days, and have an increased demand for happy-hour libations. IDENTIFYING VOLATILITY
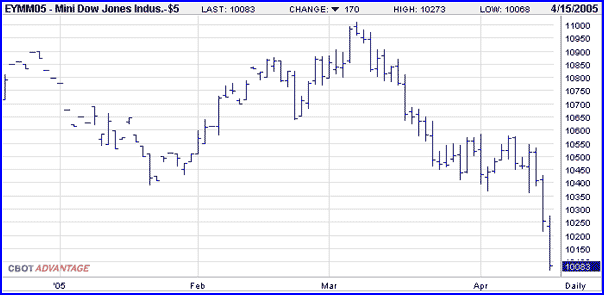
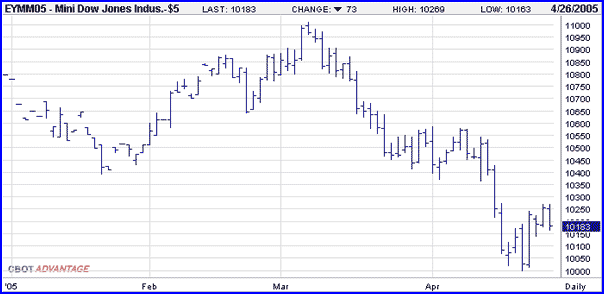
·The June 2005 mini-sized Dow closed on Friday, April 15, 2005, at 10083, down 170 points on the day, 492 points off its weekly high and 787 points off its monthly high.
In general, the daily trading ranges during these weeks were 100 points up one day and 200 points down the next day. The trend becomes unpredictable, but an increase in volume becomes predictable during volatile trading days. Volume is the driving force of the market's dynamics: real time and historical. Traders can reap significant benefits by adding a tool such as "Volume at price" to their war chest of trading paraphernalia. By using such a tool you gain transparency to price action. You know the volume at the high of the day, or the volume of the price that triggered the selloff. ADVANTAGES OF TRANSPARENCY HIGH VOLATILITY DAYS
The market was under selling pressure all week. New weekly lows and monthly lows were being set almost daily. Traders first worried about higher interest rates and then switched gears and worried that the economy might be slowing. No matter; they found reason to sell and did. The standard bar chart in Figure 1 shows a congestion area of 10580 10380.
Figure 1: This standard bar chart shows a congestion area.
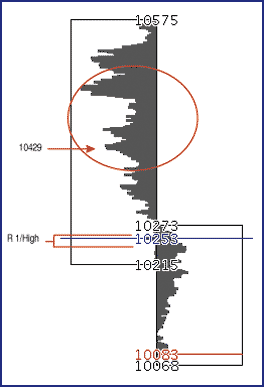
On April 1415, 2005, the market sold off once it broke the 10380 area. The week vs. day chart in Figure 2 pinpoints and compares the historical volume distribution for the trading range of the week as well as for Friday's trading range. In the display you see:
1 The high and low price for the week's trading range (left-hand side of the rectangle)
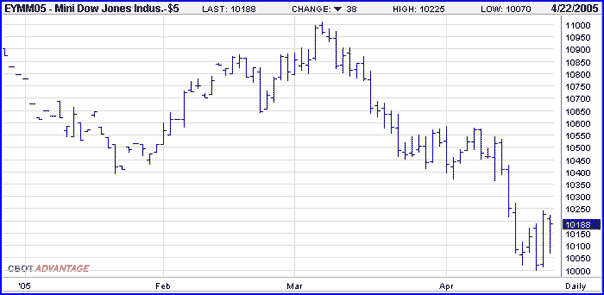
Figure 2: This week vs day chart pinpoints and compares the historical volume distribution for the trading range of the week as well as for Friday's trading range. The market swung both ways in a big manner. The conflicting economic reports and the slew of corporate earnings put new meaning to the word volatility. The standard chart in Figure 3 shows the week's trading range during the high-volatility week trading sessions (April 1822).
Figure 3: Trading week, April 18-22.
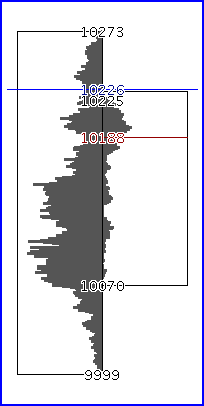
The week vs. day chart in Figure 4 pinpoints and compares the historical volume distribution for the week's trading range and for Friday's trading range. In the display you see:
1 The high and low price for the week's trading range (left-hand side of the rectangle)
Figure 4: The week vs. day chart pinpoints and compares the historical volume distribution for the week's trading range and for Friday's trading range.
Figure 4 shows how historical high volume areas can give traders key market numbers. Figure 5 shows how the market used the upper band of the high volume area of 10150 10070 to establish its daily lows on Monday, April 25, 2005, and Tuesday, April 26, 2005.
Figure 5: Standard bar chart; Monday, April 25 and Tuesday, April 26.
Trading ranges are not random, even during volatile trading days. Each price has a volume number. Historical volume at price deciphers the dynamics of price action. By adding volume at price to your war chest of trading tools, you can make more confident trading decisions. After all, a picture is worth a thousand words.
Lisa Erdmier has been a student of technical analysis for 25 years and began her involvement in commodities and equities as a technical analyst for Merrill Lynch. She is president and cofounder of www.chart-ex.com, a free website that provides traders with an intuitive volume at price trading tool for derivatives.
Current and past articles from Working Money, The Investors' Magazine, can be found at Working-Money.com. |
| Company: | Chart-Ex, LLC |
| Website: | www.chart-ex.com |
| E-mail address: | info@chart-ex.com |
Traders' Resource Links | |
PRINT THIS ARTICLE

Request Information From Our Sponsors
- StockCharts.com, Inc.
- Candle Patterns
- Candlestick Charting Explained
- Intermarket Technical Analysis
- John Murphy on Chart Analysis
- John Murphy's Chart Pattern Recognition
- John Murphy's Market Message
- MurphyExplainsMarketAnalysis-Intermarket Analysis
- MurphyExplainsMarketAnalysis-Visual Analysis
- StockCharts.com
- Technical Analysis of the Financial Markets
- The Visual Investor
- VectorVest, Inc.
- Executive Premier Workshop
- One-Day Options Course
- OptionsPro
- Retirement Income Workshop
- Sure-Fire Trading Systems (VectorVest, Inc.)
- Trading as a Business Workshop
- VectorVest 7 EOD
- VectorVest 7 RealTime/IntraDay
- VectorVest AutoTester
- VectorVest Educational Services
- VectorVest OnLine
- VectorVest Options Analyzer
- VectorVest ProGraphics v6.0
- VectorVest ProTrader 7
- VectorVest RealTime Derby Tool
- VectorVest Simulator
- VectorVest Variator
- VectorVest Watchdog

