HOT TOPICS LIST
- Strategies
- Stocks
- Buy
- Investing
- Brokers
- Psychology
- Interviews
- Accumulate
- Sell
- Hold
- Spotlight
- Websites
- Candlestick Corner
- Gold & Metals
- Options Trading
LIST OF TOPICS
TRADER'S NOTEBOOK
Time According To Wall Street
05/16/05 02:44:32 PM PSTby Edgar Kraut
Measure market time in elapsed five-minute intervals in any time zone.
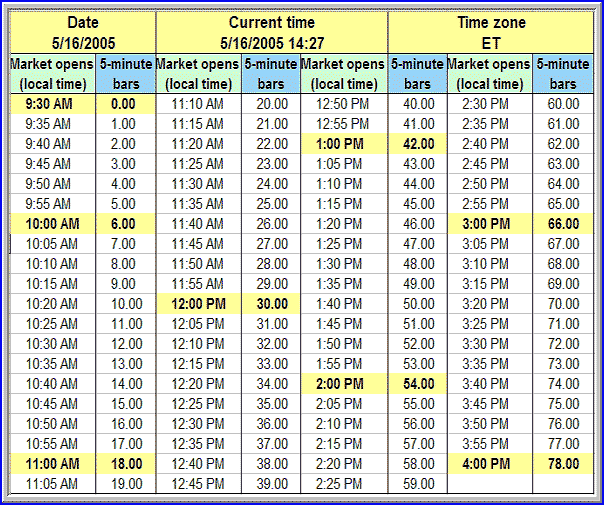
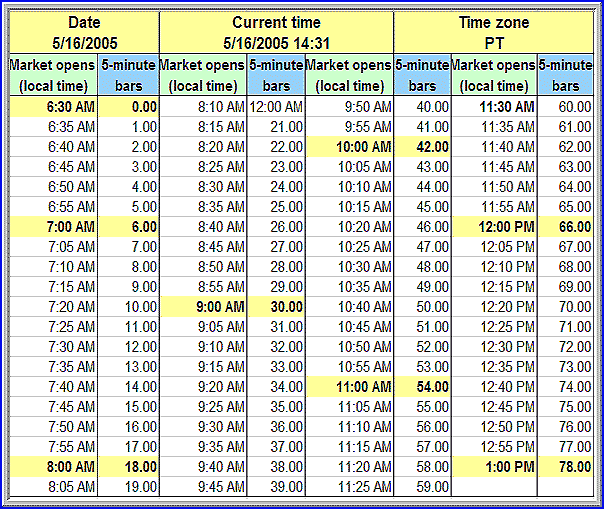
| For daytraders and traders who want to choose the best time to enter or exit a trade, real-time data is essential. These days, trading is a worldwide activity, with traders located in many different parts of the world. There are seven different time zones for North America alone. The 4 pm market closing time in New York (the New York Stock Exchange [Nyse] and Nasdaq markets open at 9:30 am Eastern time and operate for six and a half hours, closing at 4 pm) corresponds to 5 pm Atlantic time in Nova Scotia, 3 pm Central time, 2 pm Mountain time, 1 pm Pacific time, 12 noon in Alaska, and 11 am in Hawaii. A trader observing his or her own local time wants to know the corresponding number of elapsed price bars that he must first calculate to come up with the corresponding time in New York compared with his own time, the time elapsed since the 9:30 am ET market opening time, and finally, that elapsed time in bars. Active intraday traders often use charts based on five-minute price bar intervals. Given the local time, a spreadsheet can be constructed to read off the number of five-minute bars, or bars of any other time interval, that have elapsed in any time zone. ELAPSED BARS IN ANY TIME ZONE
Figure 1: Elapsed five-minute intervals as a function of local time (ET)
Figure 2: Elapsed five-minute intervals as a function of local time (PT)
When a spreadsheet is opened, the correct date and current time are shown under their respective column headings. The computer's system clock must be set to the correct local time. The number of five-minute price bars that have elapsed, corresponding to the current time, is then read from the column labeled five-minute bars. You can minimize the spreadsheet while performing other tasks. The current local time is refreshed by double-clicking it and then pressing the enter key. An Excel program to produce these spreadsheets is described in the sidebar, "Building An Excel Spreadsheet To Display Elapsed Market Time In Five-Minute Bars."
NOT AT THE COMPUTER? USE A WATCH
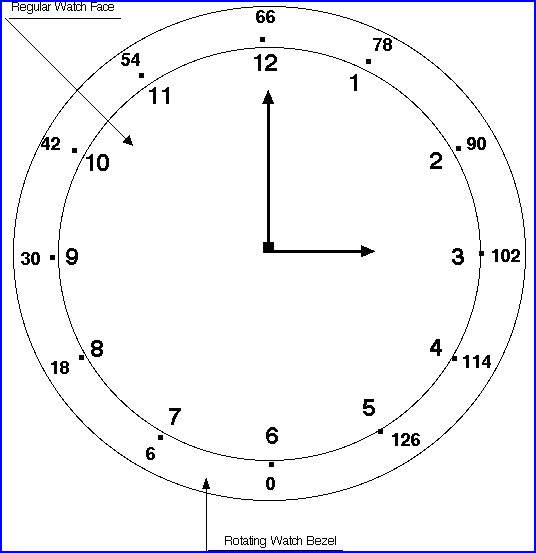
Figure 3: Watch bezel set to read elapsed five-minute price bars (PT)
The minute hand can be used to read the number of bars "past the hour." For example, at 10:15 am in Los Angeles, the minute hand is on the "3" and the hour hand is on the "10." A total of 45 five-minute price bars (42 plus three five-minute price bars) have elapsed in New York. To set the watch for any other time zone, just rotate the bezel so that the "6" is opposite the local time at which the market in New York has been in operation for 30 minutes. Some markets are open for more than the six and a half hour period of the NYSE and Nasdaq. The NYSE itself is reportedly considering opening a full two hours earlier. That would add another 24 five-minute bars to the current 78-bar trading day for a total of 102 bars. Because of these reasons, I have extended the numerals on the rotating watch bezel shown in Figure 3 beyond 78 by 12-bar increments for each additional hour of market operation. Eventually, all markets will trade electronically 24 hours a day.
INTRADAY CHART PATTERNS
Market opens
Vince Heiker has extensively studied market cycles. His spreadsheet, "Nasdaq Daily Time-Cycles Guide," should help you determine market time for you.
SUMMARY Edgar A. Kraut is a private trader. He can be reached at ed_kraut@yahoo.com. SUGGESTED READING
SIDEBAR: Building An Excel Spreadsheet To Display Elapsed Market Time In Five-Minute Bars
Steps
Usage
Modification For Other Time Zones Steps
Notes Current and past articles from Working Money, The Investors' Magazine, can be found at Working-Money.com. |
PRINT THIS ARTICLE

Request Information From Our Sponsors
- StockCharts.com, Inc.
- Candle Patterns
- Candlestick Charting Explained
- Intermarket Technical Analysis
- John Murphy on Chart Analysis
- John Murphy's Chart Pattern Recognition
- John Murphy's Market Message
- MurphyExplainsMarketAnalysis-Intermarket Analysis
- MurphyExplainsMarketAnalysis-Visual Analysis
- StockCharts.com
- Technical Analysis of the Financial Markets
- The Visual Investor
- VectorVest, Inc.
- Executive Premier Workshop
- One-Day Options Course
- OptionsPro
- Retirement Income Workshop
- Sure-Fire Trading Systems (VectorVest, Inc.)
- Trading as a Business Workshop
- VectorVest 7 EOD
- VectorVest 7 RealTime/IntraDay
- VectorVest AutoTester
- VectorVest Educational Services
- VectorVest OnLine
- VectorVest Options Analyzer
- VectorVest ProGraphics v6.0
- VectorVest ProTrader 7
- VectorVest RealTime Derby Tool
- VectorVest Simulator
- VectorVest Variator
- VectorVest Watchdog


