HOT TOPICS LIST
- Strategies
- Stocks
- Buy
- Investing
- Brokers
- Psychology
- Interviews
- Accumulate
- Sell
- Hold
- Spotlight
- Websites
- Candlestick Corner
- Gold & Metals
- Options Trading
LIST OF TOPICS
MARKET UPDATE
Yearning For Euros
08/03/05 10:44:03 AM PSTby David Penn
Tracking sentiment and technicals in Europe's common currency.
| "Make up, to break up, that's all, we do First you love me, then you hate me, That's a game for fools "
I don't know how many readers remember that soul music classic from the Stylistics, but those lyrics do an excellent job of encapsulating the mood of those trying to decide whether they love or hate the euro. After "no" votes in France and the Netherlands on the constitution for the European Union in May and June of 2005 — a constitution that was a key part in furthering the European economic integration symbolized by the common currency known as the euro — the euro became once again a figure of scorn by many on the continent. As recently as late July, Italian Prime Minister Silvio Berlusconi called the euro a "disaster," according to a report in Bloomberg News. Berlusconi, who will face a re-election battle against former European Commission president Romano Prodi in 2006, blamed the euro for rising prices and a stagnant Italian economy. With the euro off some 18 cents from its all-time high near $1.37 in December 2004, is it any coincidence that this anti-euro sentiment is growing? As Bloomberg reports, no one expects Italy to leave the "eurozone" — so the level of disgust expressed by Berlusconi is probably consistent with the relative mildness of the euro's correction. But as we've seen with markets in bullish mode, even the slightest retreat (think of the stumbles in the late 1990s in the American stock markets), can be accompanied with a noteable measure of discontent.
DOLLAR DOOM Unfortunately for the dollar doomsayers, that Time magazine article was also the equivalent of the Sports Illustrated curse (in which athletes featured on the cover of the leading sports weekly have an odd habit of underperforming for months afterwards). That is to say that "Wither the Dollar?" appeared just as the "withering" dollar was about to sprout new wings and begin moving relentlessly higher. For those traders and speculators who believe that sentiment is a dish best served contrariwise, the shifting mood between loving and loathing a currency is a classic example of why it is often so profitable to fade the conventional wisdom. As Jesse Livermore reminds us, prices are never too high to buy and never too low to sell. Indeed, the booming NASDAQ of the late 1990s and the booming housing market of the early 2000s show us that conventional wisdom can carry a market higher than anyone — even the "conventioneers" themselves — can imagine. Today, the love/hate affair with the euro reminds us that one emotion really is the flip side of the other, and when it comes to trading — where love or hate is most pronounced in the market place — we should see opportunity with every mood shift.
FIVE WAVES UP ON THE EURO
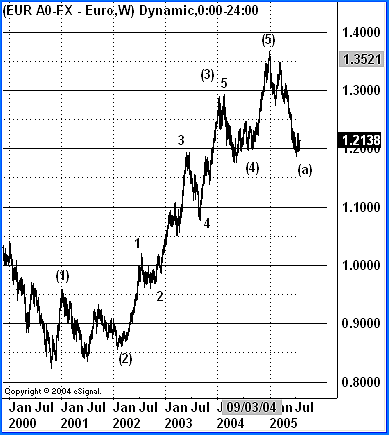
Figure 1: A completed five-wave advance in this weekly chart suggests that the euro should enter a consolidation period characterized by a three-wave A-B-C pattern. The next significant move should be upward.
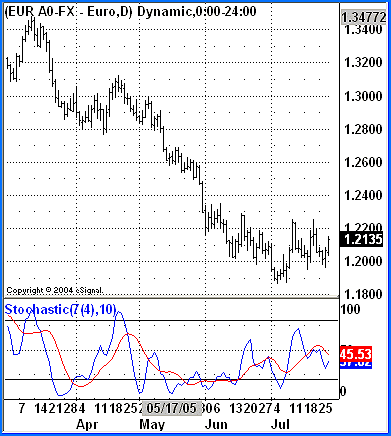
The wave count in Figure 1 suggests that the euro has completed a five-wave pattern to the upside, beginning near 85 cents in late 2000 and ending near $1.35 in late 2004. We can see it was the third wave that was extended — an extension not at all uncommon, especially in a four-year cyclical bull market. Since making a top in late 2004, the euro appears to have entered the first "a" wave of an A-B-C correction. In fact, it appears as if this "a" wave is all but completed. This can be surmised from the fact that the decline has managed to find support at approximately the same level as the wave (4) from the previous five-wave advance. If this does turn out to be the case, then traders and speculators can anticipate a sharp and likely swift bounce in the euro that would take prices up toward a test of the $1.30 level. What is the case for a temporary bottom in the $1.20 area? Beyond the presence of support from the previous wave (4) low, the euro has been displaying positive divergences on the daily chart for the past several weeks. These running divergences have been tricky to trade, insofar as volatility likely shook out more than a few, faint-hearted bottom pickers, but the implications of the divergences, as seen in Figure 2, may be hard to ignore.
Figure 2: The stochastic spent the entirety of May and June putting in higher lows as the EUR/USD moved lower. But the higher stochastic low in earliest July might do the trick for those looking to buy a reversal to the upside.
It appears that while $1.20 was the bottom, the euro did provide a brief feint to the downside by way of the early July bear trap that was reversed about five days after the $1.20 level was breached to the downside. Since then, the euro appears to have carved out a downwardly-slanted head and shoulders bottom which, if confirmed, should result in a move back to the upside sometime in August. Given the formation size of the head and shoulders bottom (approximately three cents from $1.22 to $1.19), traders and speculators should prepare for a minimum move to the $1.25 area. This area, if reached, could provide a measure of resistance insofar as there is a downwardly-slanted consolidation range from the second half of May that awaits just above $1.25.
BUILDING A BETTER BOTTOM
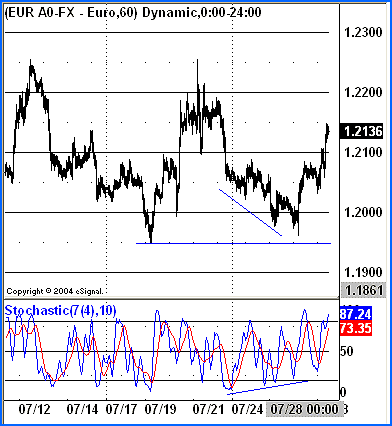
Figure 3: A higher low in late July vis-à-vis the mid-month low is a positive for a rising EUR/USD in this hourly chart. Note also the running positive stochastic divergence that accompanies the higher low in late July.
There are a number of technical features here worth pointing out. The first is the higher low in late July compared to the lower low in mid-July. The first step of every uptrend is a higher low, and if the EUR/USD is to advance over the next several weeks, that first step must begin somewhere. So far, it appears that the higher low on July 27 may be that first step. The second significant technical feature is the running positive stochastic divergence that began on July 22 and works through the final low on the 27th. In some ways, the running divergence here on the 60-minute chart resembles the running divergence seen on the daily chart in Figure 2. This is the sort of fractal behavior of prices that traders and speculators can exploit to their advantage when looking at a given market in a number of different time frames. At a recent Chicago Trader's Expo, Brandon Frederickson, (trader, trading coach, and swing trading commentator at Market Vu), underscored how effective monitoring different time frames can be in terms of setting up the lower risk entry points for trades. As he put it, this approach "allows you to set a risk parameter based on an intraday level instead of a daily level." He called it the "day trade transition to swing trading." The effectiveness of this approach can be see by comparing the 60-minute chart in Figure 3 with the daily chart in Figure 2, and from comparing the daily chart to the weekly chart in Figure 1. The gift of the "day trade transition" keeps on giving. Consider the 13-minute chart of the EUR/USD in Figure 4:
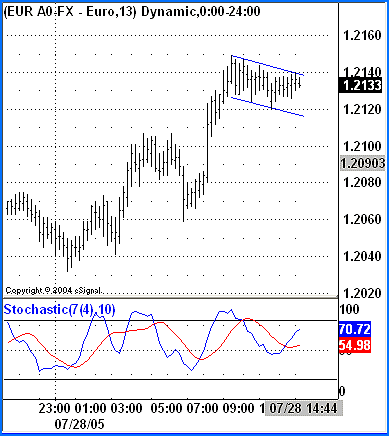
Figure 4: This sideways consolidation in the 13-minute chart could provide an excellent low risk entry point for a trader or speculator looking for a multi-hour move to the upside.
I'm looking at this 13-minute chart in real-time on Thursday, July 28. Long EUR/USD from 1.2047, I exited earlier today at 1.2133 for a solid 86 pip gain. Because I am bullish on the Euro in the intermediate-term — for reasons I'll discuss in the next section — I'm looking for reduced-risk opportunities to get long again. Right now, the flag-shaped pullback on the 13-minute chart looks as if it might provide just that sort of opportunity. There is a pivot low at 1.2120, which provides a make or break point, and the stochastic has turned upward with the rally over the past hour or so. In particular, I am looking to see whether the standard 20, 4, 20 stochastic (not shown here) moves back into overbought territory. This I would take as a sign that true bullish strength was back and capable of taking the EUR/USD higher. Assuming I get the entry I want, I will gradually transition to the hourly chart, and eventually to the daily EUR/USD charts, looking for both possible resistance, as well as additional opportunities to add to my position.
BEYOND THE BOUNCE
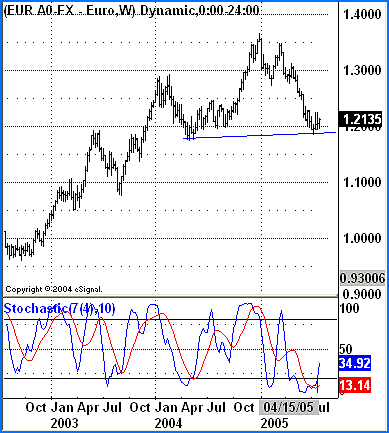
Figure 5: A potential head and shoulders top? The left shoulder and head of that classic reversal pattern are already completed. A rally toward $1.30, followed by a correction and reversal that took the EUR/USD below $1.20 would make the pattern official.
As the chart shows, there is clearly more work to be done if the EUR/USD is to complete a head and shoulders top. But the magnitude of such a pattern on the weekly scale is such that even if there is a slight possibility of the kind of downturn a one-and-a-half to two-year bearish reversal pattern would produce, then it would be nothing short of irresponsible for traders and speculators not to be, at a minimum, aware of it. Projecting down from the neckline of this pattern-in-waiting suggests a minimum downside of 15 cents. Taken from the value at the neckline of $1.20, this points to a euro that is unimaginably close to parity with the US greenback. Even if such an event does occur, it would still likely be far enough in the future for traders and speculators to prepare themselves for it. In the meanwhile, there will be plenty of time for those with more passion than patience to swear allegiance to (or to just swear at) the euro, or the dollar, or both, or neither, before the time for talking is done and the new trends become evident to all.
David Penn may be reached at DPenn@Traders.com. SUGGESTED READING Current and past articles from Working Money, The Investors' Magazine, can be found at Working-Money.com.
|
Technical Writer for Technical Analysis of STOCKS & COMMODITIES magazine, Working-Money.com, and Traders.com Advantage.
| Title: | Traders.com Technical Writer |
| Company: | Technical Analysis, Inc. |
| Address: | 4757 California Avenue SW |
| Seattle, WA 98116 | |
| Phone # for sales: | 206 938 0570 |
| Fax: | 206 938 1307 |
| Website: | www.traders.com |
| E-mail address: | DPenn@traders.com |
Traders' Resource Links | |
| Charting the Stock Market: The Wyckoff Method -- Books | |
| Working-Money.com -- Online Trading Services | |
| Traders.com Advantage -- Online Trading Services | |
| Technical Analysis of Stocks & Commodities -- Publications and Newsletters | |
| Working Money, at Working-Money.com -- Publications and Newsletters | |
| Traders.com Advantage -- Publications and Newsletters | |
| Professional Traders Starter Kit -- Software | |
PRINT THIS ARTICLE

Request Information From Our Sponsors
- StockCharts.com, Inc.
- Candle Patterns
- Candlestick Charting Explained
- Intermarket Technical Analysis
- John Murphy on Chart Analysis
- John Murphy's Chart Pattern Recognition
- John Murphy's Market Message
- MurphyExplainsMarketAnalysis-Intermarket Analysis
- MurphyExplainsMarketAnalysis-Visual Analysis
- StockCharts.com
- Technical Analysis of the Financial Markets
- The Visual Investor
- VectorVest, Inc.
- Executive Premier Workshop
- One-Day Options Course
- OptionsPro
- Retirement Income Workshop
- Sure-Fire Trading Systems (VectorVest, Inc.)
- Trading as a Business Workshop
- VectorVest 7 EOD
- VectorVest 7 RealTime/IntraDay
- VectorVest AutoTester
- VectorVest Educational Services
- VectorVest OnLine
- VectorVest Options Analyzer
- VectorVest ProGraphics v6.0
- VectorVest ProTrader 7
- VectorVest RealTime Derby Tool
- VectorVest Simulator
- VectorVest Variator
- VectorVest Watchdog

