HOT TOPICS LIST
- Strategies
- Stocks
- Buy
- Investing
- Brokers
- Psychology
- Interviews
- Accumulate
- Sell
- Hold
- Spotlight
- Websites
- Candlestick Corner
- Gold & Metals
- Options Trading
LIST OF TOPICS
THE CHARTIST
Bollinger Bands Vs. Trading Bands
08/17/05 02:15:22 PM PSTby John Devcic
Battle of the bands! (Cue air guitar.) Two distinctly different, yet similar trading tools.
| Bollinger Bands are one of the most widely recognized technical analysis techniques around and can be found in the dropdown menus of most charting software, free or paid. They are also arguably the most widely misused and misunderstood technical analysis technique around. Before a trader can apply the Bollinger Bands to their full potential, a clear definition of the bands, as well as their proper use, is certainly in order. TRADING BANDS
BOLLINGER BANDS Despite their similar definitions, the fundamental difference between Bollinger Bands and plain old trading bands is striking. As mentioned previously, trading bands are plotted at a predetermined fixed percentage above and below the moving average. Bollinger Bands, on the other hand, are plotted at standard deviation levels above and below a moving average. In this case, standard deviation is a statistical measure of volatility. In essence, this allows Bollinger Bands to be self-adjusting, making them more effective than the average trading band. Theoretically, they provide a more robust and accurate definition of high and low ranges. Before continuing with more in-depth discussion of Bollinger Bands, it is essential to stress the major similarity between trading bands and Bollinger Bands. While they differ in placement and accuracy, both were designed as reference points for highs and lows. Neither Bollinger Bands nor trading bands were meant to be used as a tool to plot entry or exit positions.
THREE BANDS
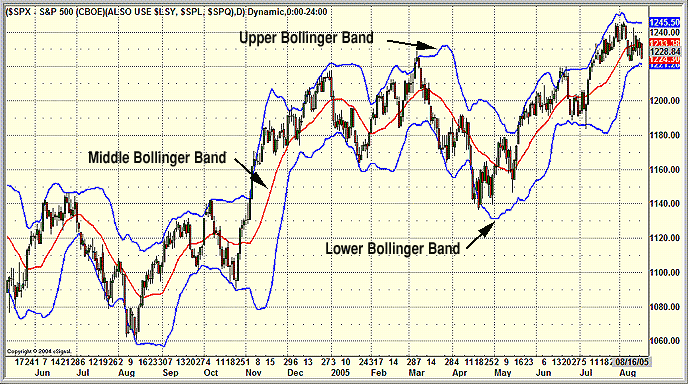
Figure 1: Bollinger Bands
While it is not really practical to plot them yourself, it is still important to know the formulas that make up Bollinger Bands:
Middle Bollinger Band = 20-period simple moving average (SMA)
All three bands are determined by volatility and usually plotted according to the day's closing prices. On a chart, the upper and lower bands are a measure of high and low volatility, while the middle band is a measure of the trend. In this case, the middle band represents a simple moving average [SMA] of 20 periods. Remember, Bollinger Bands are reference points. A move that starts at one band will tend to go all the way to the other, giving an idea of where the price will most likely move. More often than not, closes outside the Bollinger Bands are not reversal signals, but rather a continuation of the current price. Prices can and do touch the bands, but this should not be considered a buy or sell signal. As your understanding of how to use Bollinger Bands grows, you'll discover interesting ways to personalize them. For example, depending on your needs, you can change the length of the moving averages and the number of deviations. Bollinger Bands can be an effective tool to add to your trading arsenal, but they must be used properly. Keep in mind that Bollinger Bands were designed as a guide to overbought or oversold levels. They should never be the sole reason to enter or exit any position — instead, use them to give you an idea of the current state of the tradable you are studying. Applying Bollinger Bands to different charts and securities will no doubt improve your trading results. Of course, as with tweaking anything, trial and error will help you find the right combination of values that suits you best. As the old saying goes, practice makes perfect!
RULES TO KEEP IN MIND
John Devcic is a market historian and freelance writer. He may be reached at glatko@aol.com.
RECOMMENDED READING ·http://www.bollingerbands.com/ Current and past articles from Working Money, The Investors' Magazine, can be found at Working-Money.com.
|
John Devcic is a market historian and freelance writer. He may be reached at drmorgus@gmail.com
| E-mail address: | drmorgus@gmail.com |
PRINT THIS ARTICLE

Request Information From Our Sponsors
- StockCharts.com, Inc.
- Candle Patterns
- Candlestick Charting Explained
- Intermarket Technical Analysis
- John Murphy on Chart Analysis
- John Murphy's Chart Pattern Recognition
- John Murphy's Market Message
- MurphyExplainsMarketAnalysis-Intermarket Analysis
- MurphyExplainsMarketAnalysis-Visual Analysis
- StockCharts.com
- Technical Analysis of the Financial Markets
- The Visual Investor
- VectorVest, Inc.
- Executive Premier Workshop
- One-Day Options Course
- OptionsPro
- Retirement Income Workshop
- Sure-Fire Trading Systems (VectorVest, Inc.)
- Trading as a Business Workshop
- VectorVest 7 EOD
- VectorVest 7 RealTime/IntraDay
- VectorVest AutoTester
- VectorVest Educational Services
- VectorVest OnLine
- VectorVest Options Analyzer
- VectorVest ProGraphics v6.0
- VectorVest ProTrader 7
- VectorVest RealTime Derby Tool
- VectorVest Simulator
- VectorVest Variator
- VectorVest Watchdog

