HOT TOPICS LIST
- Strategies
- Stocks
- Buy
- Investing
- Brokers
- Psychology
- Interviews
- Accumulate
- Sell
- Hold
- Spotlight
- Websites
- Candlestick Corner
- Gold & Metals
- Options Trading
LIST OF TOPICS
TRADER'S NOTEBOOK
Get The "CAN" In "CAN SLIM"
08/22/05 11:09:25 AM PSTby Sharon Yamanaka
Remember this classic?
| Even though it sounds like the latest diet craze, CAN SLIM is actually a trading technique developed by William O'Neil, founder of the venerable newspaper Investor's Business Daily (IBD) and author of How To Make Money In Stocks. In his book, O'Neil analyzed the market from 1970 to 1982, identifying the "big gainers," and found that they posted significant gains before their runups in price. CAN SLIM is the acronym for the seven criteria O'Neil used to identify these winning stocks. According to O'Neil,
These are the key characteristics that were present just prior to many of history's best-performing stocks:
What I like about CAN SLIM is that it is all-encompassing; about half the CAN SLIM criteria are fundamentally based, while the other half are technically oriented. In order to use CAN SLIM, you have to have a pretty good understanding of technical analysis and company finances as well as an awareness of overall market movement. If you use CAN SLIM as a market screener as O'Neil originally intended, it will find smaller stocks with large upside potential. Alternately, it can also be used to evaluate or troubleshoot current stocks or those you have under consideration. Know thine enemy as well as thyself... So where do you find such complete information for your stocks? O'Neil's newspaper, IBD, carries the data that its founder considered vital to stock trading, but — with a little elbow grease or midnight scrolling through the Internet — some websites offer this information for free. If you're starting with a particular stock, you can get fundamental information at the company's website. Look up earnings reports, and check if the earnings per share are increasing on a quarterly and annual basis, along with the stock's price and volume. You can find a lot of the same information at one of the many larger financial websites such as CBS MarketWatch or Yahoo! Finance. Technical analysis information is also available here, so I can get all the information I need to screen for CAN SLIM-worthy stocks at these two sites. They are two of the largest financial sites and provide a plethora of information, as well as stock screeners for investors at every experience level and trading technique. But there are many more.
MARKET SCREENING To show you how the CAN SLIM technique starts, I'll walk you through the first three steps.
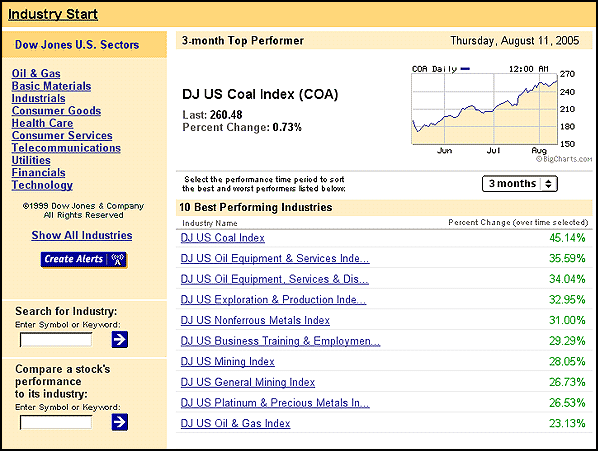
C: Current quarterly earnings per share. These are calculated by dividing a company's total after-tax profits by the number of common shares outstanding. I decided to start by looking up the strongest stocks in the strongest sector. (See Figure 1.) For this, I went to CBS MarketWatch's Industry Leaders page.
Figure 1: Three-month top performers
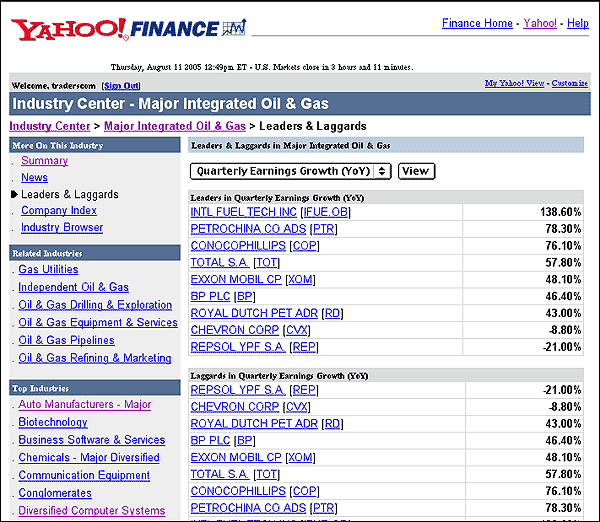
Out of the top performers, I liked oil equipment and services. From there, I decided to look up the leaders in the sector at Yahoo! Finance, where they have a leaders and laggards screener. To find my "C," I looked up major integrated oil and gas, leaders and laggards in the quarter revenue growth. (See Figure 2.)
Figure 2: Quarterly growth leaders and laggards. They're the same but inverted, meaning there are only a few companies in this category.
The first company on the list, International Fuel Tech, Inc., isn't traded on a large exchange, so I skipped on down to PetroChina Co. (PTR). Earnings were up 78% for the quarter. Good. On to annual earnings.
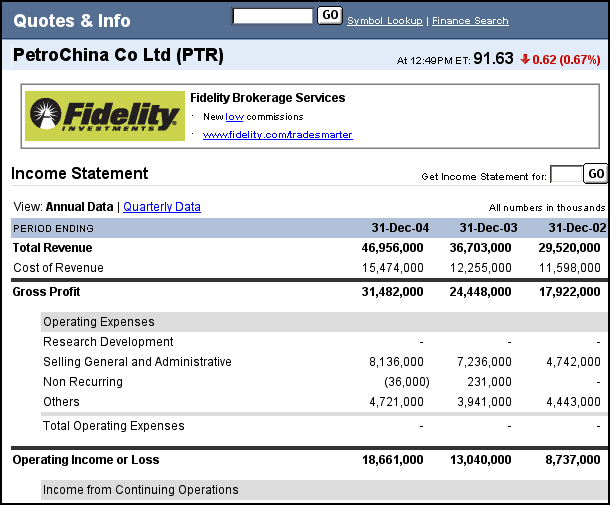
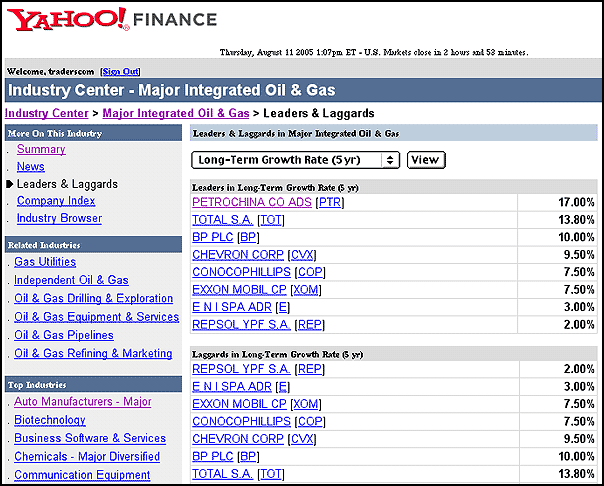
A: Annual earnings increase. According to William O'Neil, "Each year's annual earnings per share for the last five years should show an increase over the prior year's earnings." And they should have an annual growth rate of at least 15% per year. He cites the targeted growth rate at more than 50% growth. Anther important factor is consistent annual earnings increase — all of the growth shouldn't be confined to a single year. High price/earnings ratios aren't significant, although I've noticed that higher P/E earnings cause analysts to downgrade the stock, causing the price to fall. And O'Neil insists that both annual and quarterly earnings be excellent. To take my "C" to the "A," I looked up PetroChina's annual earnings, as you see in Figures 3 and 4.
Figure 3: PetroChina's earnings are showing smooth, increasing growth over the last three years.
Figure 4: PTR is up 17% in the past five years. That's above CAN SLIM's 15% criterion.
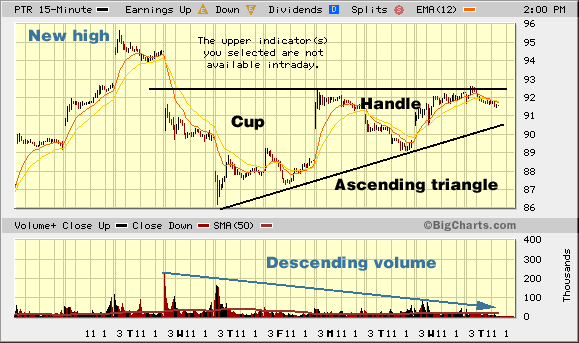
N: New products, new management, new highs. Now I'm looking for a good entry point, and watching for new press releases on the targeted stock so I can "buy at the right time." I can sign up to get breaking news and alerts from CBS MarketWatch, and most brokerages have some sort of alert system. But I'm also looking at new highs, following periods of consolidation. O'Neil likes the cup-with-handle formation, which is often an ascending triangle. I also use the 50- and 200-day moving averages as support and buy in when prices touch one of them. I don't see any of these on the daily chart, so I check the intraday chart. True to its name, a cup-with-handle forms when a stock reaches a new high, followed by a dip in price as profit-taking occurs and the stock consolidates. This forms the cup. Then prices rebound to the high, followed by a smaller dip, which is the handle, followed by a breakout to new prices. As the stock consolidates, volume decreases. According to CAN SLIM, the breakout will ideally occur when there is significant news about the stock: new product or new management announcements in conjunction with high volume. Looking at the intraday chart in Figure 5, PTR reached a new 52-week high of $95.65 on August 9. The high was indeed followed by a (gappy) cup formation and a handle, but the breakout failed to occur. There were no new press releases concerning the stock. But the cup-with-handle formed on descending volume, an important part of a true consolidation.
Figure 5: The technicals. Intraday chart of PTR showing the cup-with-handle formation with descending volume.
Right now, I'm thinking it's back to the drawing board for this candidate for my portfolio. Along with a lack of followthrough on the cup-with-handle, this stock isn't a small cap by any means.
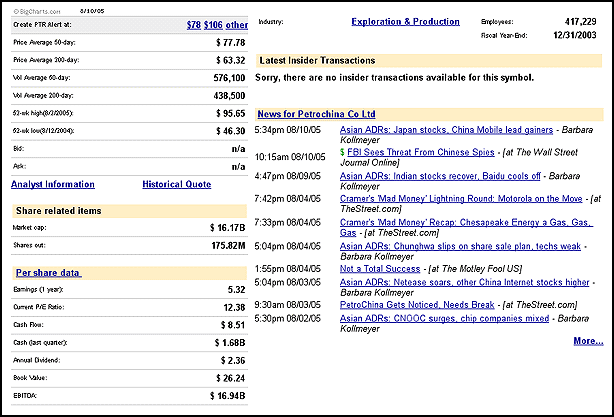
Figure 6: PTR's company profile from Yahoo! Finance, with all the accompanying links.
As the company profile in Figure 6 shows, PTR has a market cap of $16.5 billion — anything over $5 billion is considered large cap — and 172.85 million shares outstanding. O'Neil suggested that a stock with 10 million shares outstanding is easier to budge than one with 100. Given a choice, he advises traders to pick the smaller of the two because it will probably be the more nimble in movement. On the other hand, larger stocks are more stable. PTR is also a China-based company, and it was hard to get quarterly financial information on them. So, for now, I'm putting this stock on hold and looking for something better. CAN SLIM has its own website, www.canslim.net, where their stock picks are listed. I was unable to duplicate their list, which means there's something subjective about their criteria — probably time frame, to name one. But they did list Conoco Phillips (COP), the next one on my list of oil and gas quarterly earnings growth leaders and laggards. I also noticed that when I put many of the CAN SLIM criteria into Yahoo!'s stock screener, I came up with nothing! You only get the best, gilt-edged long-term stocks when you use this approach — and these are few and far between. In my next article, I'll talk about the SLIM in CAN SLIM.
Sharon Yamanaka may be reached at SYamanaka@Traders.com. SUGGESTED READING
Current and past articles from Working Money, The Investors' Magazine, can be found at Working-Money.com.
|
| Title: | Staff Writer |
| Company: | Technical Analysis, Inc. |
| Address: | 4757 California AVE SW |
| Seattle, WA 98116 | |
| Phone # for sales: | 206 938 0570 |
| Fax: | 206 938 1307 |
| Website: | www.Working-Money.com |
| E-mail address: | syamanaka@traders.com |
Traders' Resource Links | |
| Charting the Stock Market: The Wyckoff Method -- Books | |
| Working-Money.com -- Online Trading Services | |
| Traders.com Advantage -- Online Trading Services | |
| Technical Analysis of Stocks & Commodities -- Publications and Newsletters | |
| Working Money, at Working-Money.com -- Publications and Newsletters | |
| Traders.com Advantage -- Publications and Newsletters | |
| Professional Traders Starter Kit -- Software | |
PRINT THIS ARTICLE

Request Information From Our Sponsors
- StockCharts.com, Inc.
- Candle Patterns
- Candlestick Charting Explained
- Intermarket Technical Analysis
- John Murphy on Chart Analysis
- John Murphy's Chart Pattern Recognition
- John Murphy's Market Message
- MurphyExplainsMarketAnalysis-Intermarket Analysis
- MurphyExplainsMarketAnalysis-Visual Analysis
- StockCharts.com
- Technical Analysis of the Financial Markets
- The Visual Investor
- VectorVest, Inc.
- Executive Premier Workshop
- One-Day Options Course
- OptionsPro
- Retirement Income Workshop
- Sure-Fire Trading Systems (VectorVest, Inc.)
- Trading as a Business Workshop
- VectorVest 7 EOD
- VectorVest 7 RealTime/IntraDay
- VectorVest AutoTester
- VectorVest Educational Services
- VectorVest OnLine
- VectorVest Options Analyzer
- VectorVest ProGraphics v6.0
- VectorVest ProTrader 7
- VectorVest RealTime Derby Tool
- VectorVest Simulator
- VectorVest Variator
- VectorVest Watchdog

