HOT TOPICS LIST
- Strategies
- Stocks
- Buy
- Investing
- Brokers
- Psychology
- Interviews
- Accumulate
- Sell
- Hold
- Spotlight
- Websites
- Candlestick Corner
- Gold & Metals
- Options Trading
LIST OF TOPICS
THE CHARTIST
Applying Technical Analysis In Nonliquid Markets
08/29/05 02:10:49 PM PSTby Alexander Nikolov
Can technical analysis be used in low volume markets? Of course it can.
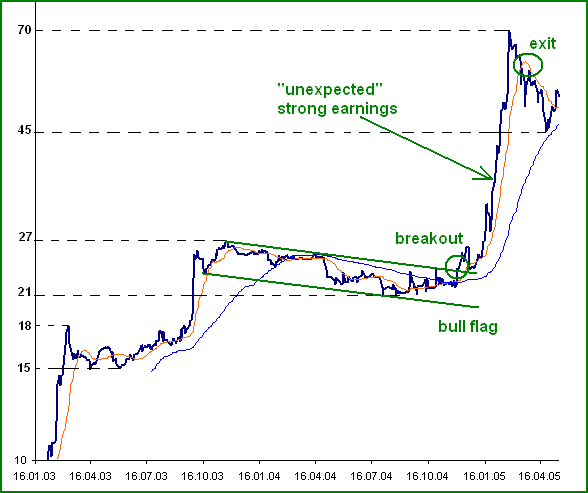
| One important prerequisite for the application of technical analysis is that the commodities or stocks to be analyzed must be liquid; they must attract significant public interest so the price charts reflect popular sentiment. That is why most investors of emerging markets, which characteristically have low volume levels, avoid using technical analysis tools. The general belief is that the only successful approach in such markets is to study the fundamentals (macroeconomic data and companies' financials), and that any attempt to analyze these markets using technical analysis will be fruitless. Wrong. BULL FLAGS One of the most striking examples of how investor psychology changes before the fundamentals do can be found in Figure 1, which shows a chart of the Bulgarian chemical company Orgachim (ORGH). It is one of the blue-chip companies listed on the BSE. In 2004, SOFIX — the major Bulgarian Stock Exchange index — gained 40%, while ORGH shares lost 7%. At that time, the market did not find the stock to be that appealing, as the company had huge debts and only generated minor profits. From a charting point of view, however, we could see a textbook bull flag pattern had been developing for most of that year. In late December 2004, the price broke above the upper line of the channel drawn on Figure 1. Fundamental investors continued to dismiss the stock, but from a technical perspective, the stock was a buy because:
As illustrated in Figure 1, the price oscillated around BGN 25 for almost a month (from mid-December 2004 to mid-January 2005) before it shot up. Then in late January 2005, an unexpectedly positive financial report came out showing significant improvement in the company's earnings. In the skyrocketing Bulgarian market, this stock became one of the cheapest (measured by the widely used price/earnings ratio, where it stood at 5 at that time), and investors started to buy it aggressively. As a result, within a month, the price soared to BGN 70 before pulling back in March and April.
Figure 1: Daily chart of Orgachim (ORGH). The breakout of the bull flag preceded the release of the unexpectedly strong earnings a month later.
Note how the prices stayed firmly above the 21- and 100-day EMAs during this spectacular bull run. The subsequent breach of the 21-day EMA provided a short-term exit signal. That the price is above the 100-day EMA (at BGN 45) indicates that the larger trend is still defined as "up," and so the present weakness may turn out to be another good buying opportunity. A fall below BGN 45 would confirm that a major top had been reached. Investor psychology turned positive a month before the fundamentals showed improvement. By using simple technical analysis tools, market participants could have spotted this shift and taken advantage of it. TRIANGLES
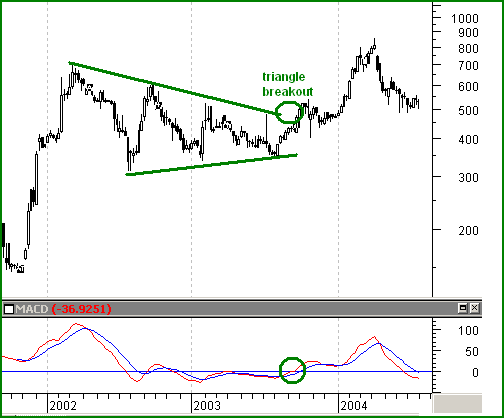
Figure 2: Weekly chart of Avtovaz. The year-and-half sideways consolidation of a textbook symmetrical triangle was followed by a 100% rally.
In addition, observe how the triangle consolidation was confirmed by the moving average convergence/divergence (MACD) indicator's pattern, which also developed into a symmetrical triangle. At the same time the price triangle was broken on the upside, the MACD oscillator penetrated the zero line and moved above its previous peak — an opportunity you could not afford to miss. In a situation like this, you should immediately enter a long position and never go against it! EXPONENTIAL MOVING AVERAGE
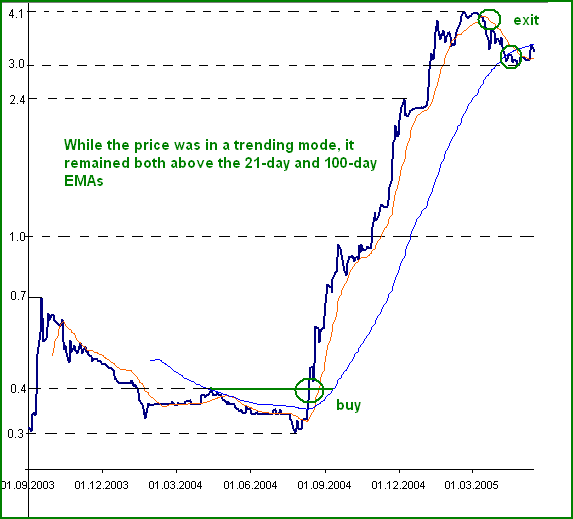
Figure 3: Daily chart of Industrial Holding Bulgaria (IHLBL). Once the price broke above the 100-day EMA and previous chart resistance at 0.4, the uptrend accelerated.
As you can see from this chart, once the price broke above the 100-day EMA and moved above BGN 0.4, the stock was supposed to be in a trending mode (and the trend was up). Note how the prices stayed above the 21-day EMA during this entire spectacular bull run. So if you were to use the 21-day EMA as a trailing stop, you would be able to participate in this market euphoria. It is interesting to note that in 2003 and 2004, the company's fundamentals were exactly the same as those in early 2005, but the trend was mostly sideways in 2003 and 2004. It was the general market euphoria and the break above the key technical resistance levels (above BGN 0.4 and BGN 0.7) that led to the 10-fold rise in late 2004/early 2005. Once again, those using technical analysis would have been ahead of the market, despite the general belief that illiquid markets like the Bulgarian one are mostly driven by fundamental factors and insider information. HEAD & SHOULDERS
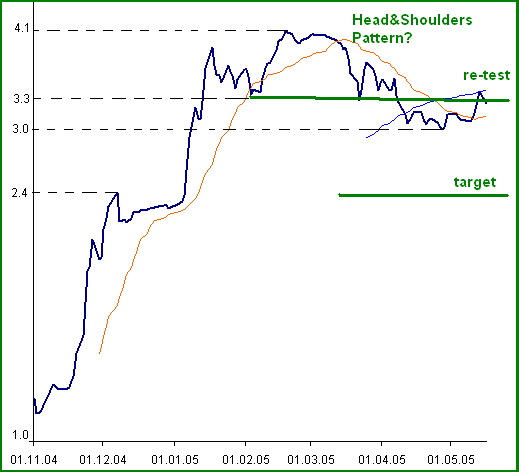
Figure 4: Daily chart of Industrial Holding Bulgaria (IHLBL). A possible head & shoulders reversal pattern points to lower prices in the near future. STAYING AHEAD Further, I have found that limited public attention (due to the lack of significant volume) is an obstacle in profitably applying more complex techniques like Fibonacci retracement and projection levels, or the Elliott wave principle. On the other hand, when I try to analyze a market index, such as the market indexes in Bulgaria (SOFIX) and Russia (Micex 10), the chart patterns are sometimes clearer. Thus, using the wave principle together with the Fibonacci retracement and projection levels can significantly improve accuracy.
Alexander Nikolov is the chief technical analyst and head of the international capital markets department at Karoll Finance House (www.karoll.net), a leading Bulgarian brokerage firm. His experience includes coverage of the US stock market, eastern European markets, and major currencies. Charts by Karoll Finance House, Bulgaria Current and past articles from Working Money, The Investors' Magazine, can be found at Working-Money.com.
|
| Title: | Chief Technical Analyst |
| Company: | Karroll Finance House |
| Website: | www.karroll.net |
Traders' Resource Links | |
PRINT THIS ARTICLE

Request Information From Our Sponsors
- StockCharts.com, Inc.
- Candle Patterns
- Candlestick Charting Explained
- Intermarket Technical Analysis
- John Murphy on Chart Analysis
- John Murphy's Chart Pattern Recognition
- John Murphy's Market Message
- MurphyExplainsMarketAnalysis-Intermarket Analysis
- MurphyExplainsMarketAnalysis-Visual Analysis
- StockCharts.com
- Technical Analysis of the Financial Markets
- The Visual Investor
- VectorVest, Inc.
- Executive Premier Workshop
- One-Day Options Course
- OptionsPro
- Retirement Income Workshop
- Sure-Fire Trading Systems (VectorVest, Inc.)
- Trading as a Business Workshop
- VectorVest 7 EOD
- VectorVest 7 RealTime/IntraDay
- VectorVest AutoTester
- VectorVest Educational Services
- VectorVest OnLine
- VectorVest Options Analyzer
- VectorVest ProGraphics v6.0
- VectorVest ProTrader 7
- VectorVest RealTime Derby Tool
- VectorVest Simulator
- VectorVest Variator
- VectorVest Watchdog


