HOT TOPICS LIST
- Strategies
- Stocks
- Buy
- Investing
- Brokers
- Psychology
- Interviews
- Accumulate
- Sell
- Hold
- Spotlight
- Websites
- Candlestick Corner
- Gold & Metals
- Options Trading
LIST OF TOPICS
THE OPTIMIZED TRADER
Trading With Trendlines
08/29/05 02:47:57 PM PSTby David Penn
Confused about market direction? Try a trendline to help you see things as they really are.
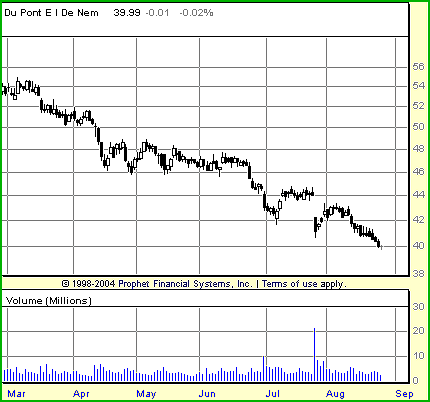
| I was browsing through one of my favorite Internet message-boards for traders a few weeks ago when I came across a thread titled, "Do Trendlines Really Work?" At first, I thought it had to be a setup. Maybe the author titled his or her thread this way in order to unleash a devastating critique of trendlines, replete with examples of trendline breaks that reversed to resume their previous trends and other such violations of preferred trendline behavior. Or maybe the author was more clever, setting up a straw man argument that would be subsequently demolished by a dazzling array of examples in which trendlines accurately guided strong price moves. I could already imagine the charts — for or against trendlines forever! That's the kind of cynical thinking that develops when you spend too much time in Internet message-boards. For as I looked, it appeared that the author was sincere in his or her question. No tricks, no fury over trendlines that "failed," no rejoicing over trendlines that "worked," just a simple question from a fledgling trader (or a trader whose use of trendlines was fledgling-like): Are these trendline things worth my time? The fact of the matter is that a trendline is to what trader, author, and trading educator John J. Murphy calls "visual investing" what a stethoscope or tongue depressor is to a doctor. While there are a countless number of tools that investors, speculators, and traders can use to determine market direction (past, recent, and anticipated), nothing looks at the market and says, "Open wide and say 'Ahh'" like a trendline. To this end, learning why and how trendlines are drawn, how to interpret them and, hopefully, how they can be used to anticipate future price moves is a critical skill for every market technician. When all else appears to fail moving averages, oscillators, volatility indicators — trendlines are a simple, yet effective way of figuring out which way is up. Or down, as the case may be. See Figure 1.
Figure 1: Trending market. Consistently lower lows and lower highs are the definition of a downtrend. Higher lows and higher highs define an uptrend. THE BIG SWING
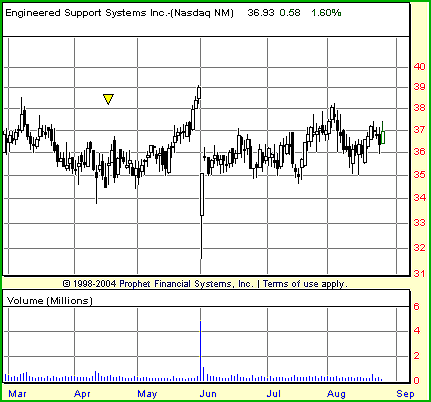
This is a basic — and essential — point. Putting aside the arguments of the random walk crowd, who do in fact insist that stocks "jump up and down in an altogether random fashion," this understanding is still occasionally lost on aspiring (or often merely exasperated) market technicians. Ironically, this misunderstanding is often most apparent when a trend has run its course and a market has slipped into a consolidation range. Frustrated and, more important, impatient with a market that will not show its direction, many technicians (even against their better judgment) will begin to entertain notions of trends as fleeting will-o'-the-wisps, impossible to anticipate and too crafty to ride until it is too late. Indeed, it is precisely the development of this psychology that leads to the break from a consolidation range and back into a new trend! See Figure 2.
Figure 2: Nontrending market. If you can't draw a trendline, then there is a good chance there is no true trend, as was the case with EASI in recent months.
While there are strategies for speculating and trading the markets that are trend-agnostic — with buy and hold investing at one end of the spectrum and contrarian top- and bottom-picking, perhaps, at the other — the practicality of trends cannot be overstated. Quoted in Michael Covel's Trend Following, an insightful ode to trend-following as a trading methodology, Paul Mulvaney, chief investment officer of Mulvaney Capital Management, suggests the following: [Trend following] is motivated by a very broad interpretation of the universe. The underlying belief is that economic systems adjust to changes in fundamentals gradually and over long periods of time, and that the consequent trends are evident everywhere in human history and commerce...
There's more to it, of course, than the fact that trends — from a certain perspective — are virtually ubiquitous. As far as traders are concerned, there is the potential for profit in this ubiquity, as Market Wizard Randy McKay alluded to in an exchange during an interview with Jack Schwager in the latter's book The New Market Wizards, a collection of interviews with top traders:
Or as the ever spot-on Jesse Livermore put it decades ago: "I began to realize that the big money must necessarily be in the big swing." WHAT'S IN A LINE?
A major problem, of course, is that markets don't move from one state to another in a straight line: there are periods of countertrend shock and volatility. We spend most of our time trying to find ways to deal with those unsettling but inevitable events. This is where the helpful maxim "higher highs and higher lows" (for uptrends) and "lower highs and lower lows" (for downtrends) come into play. This is also where trendlines come in. Able to articulate trends in price movement even when it is divided into its smallest components — as with tick and one-minute price charts — trendlines help traders and speculators separate potentially meaningful price movement from meanderings of a market still in consolidation. For this, let's return again to Edwards and Magee:
One of the first discoveries a new student is likely to make when he begins to inspect stock charts with a critical eye is that nearly all Minor and most Intermediate trends follow nearly straight lines. A few readers will, perhaps, dismiss this as perfectly natural, something to be taken for granted. But the majority becomes increasingly amazed and excited as they delve deeper. Not only the smaller fluctuations but frequently also the great Primary swings of several years' duration appear on the charts as though their courses had been plotted with a straight-edge ruler. This phenomenon is, in truth, the most fascinating, impressive and mysterious of all that the stock charts exhibit. I don't think there can be much debating this assertion. Long before indicators and oscillators began crowding price charts, much longer still before the age of mechanical trading systems, optimization, and neural net methodologies, trend analysis was synonymous with trend line analysis. This, as the excerpt from Edwards and Magee suggests, was as it should be. Trendline analysis is not only the most ready form of analysis upon encountering any price chart, it is also one of the most effective, verifiable, and indeed, impressive. Writing about trendlines in The Visual Investor, John Murphy observes that:
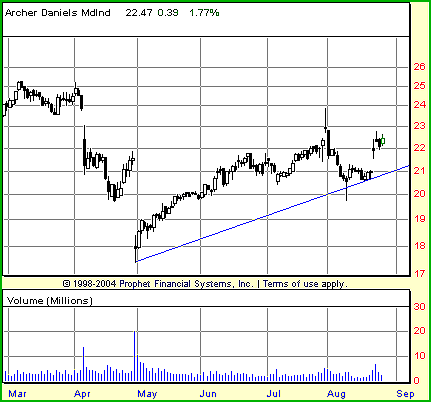
The simple trendline is possibly the most useful tool in the study of market trends. And you'll be happy to know that they're extremely easy to draw. Chart analysts use trendlines to determine the slope of a market trend and to help determine when that trend is changing. Although horizontal trendlines can be drawn on a chart, the most common usage refers to up trendlines and down trendlines. An up trendline is simply drawn under the rising reaction lows. A down trendline is drawn above the declining market peaks. Markets often rise or fall at a given slope. The trendline helps us to determine what that slope is. See Figure 3.
Figure 3: Bad trendline. The trendline in the chart of ADM is flawed because it does not pass through the highest low before the highest high. Here, this flaw obscures the fact that a 1-2-3 reversal may be setting up in late August/early September. LINE CASTING
Most chartists draw a trendline through extreme high and low points, but it is better to draw it through the edges of congestion areas. Those edges show where the majority of traders have reversed direction. Technical analysis is poll-taking — and polltakers want to track opinions of masses, not of a few extremists. Drawing trendlines through the edges of congestion areas is somewhat subjective. You have to watch out for the temptation to slant your ruler.
One way to avoid this temptation is to find or develop a method for drawing trendlines that will be consistent each time — as well as applicable to all possible time frames (that is, from tick to monthly or even yearly) and "bar durations" (as few as four or five bars in some instances). One of the best methods for drawing consistent trendlines comes from Victor Sperandeo who, in his Trader Vic: Methods Of A Wall Street Master, shows traders and speculators a method that is not only consistent, but is easy to follow:
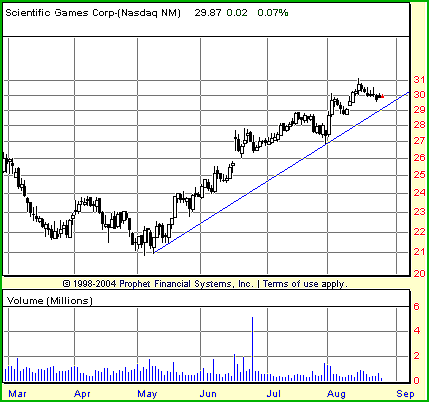
In the case of a downtrend, the trader or speculator need simply to do the opposite: Draw a line from the highest high, down and to the lowest minor high before the lowest low (see Figure 4). As in the case of an uptrend, the trendline should not pass through any prices in between the two high points. This specific step comes often at the consternation of some who prefer to ignore what Elder referred to as "a few extremists."
Figure 4: Good trendline. The trendline for SGMS accurately connects the May lows with the highest low immediately preceding the highest high in August.
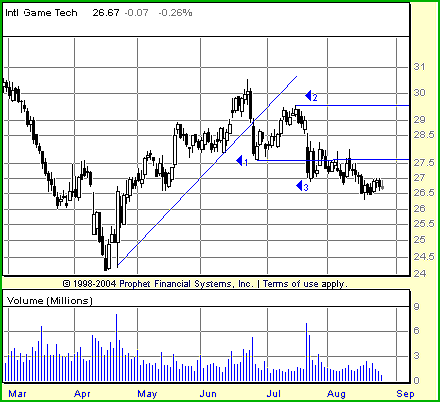
While that approach is often sound, it does begin to introduce elements of subjectivity into trendline analysis that Sperandeo's method — taken literally — avoids. After all, one trader's ignorable extreme is another trader's once-not-likely-to-be-hit stop-loss level. As such, as far as I am concerned, unless there is truly something inaccurate about a given "extreme" print, I tend to honor that print. Somebody bought and somebody sold at that level; acting as if that was not the case only adds uncertainty to the analysis. TRENDLINE TRICKS On the other hand, if a trader uses one rule to draw one sort of trendline and a different rule to draw another trendline in a different market, then that trader can't guarantee that a single trendline analysis technique — such as the breaking of a trendline — will mean the same thing in both markets. One of Sperandeo's favorite trendline tricks for spotting potential reversals with a trendline is called the 1-2-3 rule, or the 1-2-3 reversal. While Elder suggests that this method is particularly effective in dealing with "major reversals rather than shorter-term swings," a relative handicap can be avoided by switching to a shorter time frame (such as the hourly or 15-minute) to spot any of the shorter-term gyrations that might make up a longer-term daily trend. As far as the 1-2-3 rule goes, let's assume a Sperandeo-style trendline is in place. The (1) of the 1-2-3 rule refers to the initial break of the trendline. This often comes after the market has extended away from the trendline and appears at least initially to be making yet another "touch and go" with support (or resistance, in the case of a down trendline). Instead, the market appears to plow right through the trendline. This is the initial step that a great many reversals will take. The (2) in the 1-2-3 rule refers to the market's attempt to reestablish the previous trend and perhaps even test the recent high or low. Generally speaking, a market that is likely to reverse will find itself unable to resume its trend for very long and fail to set a new high or low. The (3) in the 1-2-3 rule refers to the market's retreat from the attempt to set a new high or low. Failing to do so, the market in the 1-2-3 rule will then move against the old trend, retreating from the recent high or low level and seeking to move beyond the point first established in step (1) when the initial trendline break occurred. (See Figure 5.)
Figure 5: 1-2-3 rule. The chart of IGT shows the 1-2-3 rule, or 1-2-3 trend reversal, in the days following the completed stage 3. Note how the horizontal lines help track IGT's progress at each stage of the 1-2-3 rule.
For those new to the technique, Sperandeo has even suggested drawing horizontal resistance and support lines, one at the extreme of the old trend and another at the extreme of where the market moves in step (1). This provides ready guideposts for traders to readily determine (a) if step (2) resulted in a failure and (b) when step (3) is complete, with the market moving beyond the level reached in step (1). As Sperandeo himself admits, the 1-2-3 rule is hardly infallible. In the end, markets will do what they want to do regardless of what rule is tracking them or what trader is trading them. Nevertheless, trading is about putting yourself on the side of the best odds — not unlike the relationship between a casino (trader) and the customer (market). However, by trading in liquid markets, as Sperandeo recommends, and adhering to strict loss control and money management discipline, traders and speculators can use the 1-2-3 rule to their benefit and gain in a remarkably wide variety of market situations. TRENDLINE TRUTHS
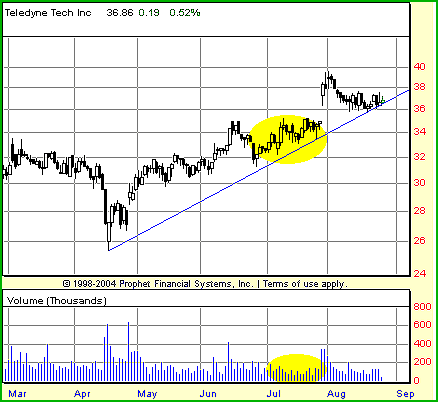
Figure 6: Volume and trendlines. Note how volume contracts as prices approach the up trendline. This is a sign of a strong trend. Just as prices appear ready to plow through the side of the trendline, buyers arrive en masse to propel the stock higher.
Alexander Elder, unsurprisingly, has done an excellent job of documenting these truths in his book Trading For A Living. So rather than reinvent the trendline (to steal a phrase), I'll simply include Elder's essential trendline observations by way of summary and conclusion. For his very much worth-reading elaboration of these key points, I urge you to pick up a copy of Trading For A Living or his more recent volume Come Into My Trading Room:
David Penn may be reached at DPenn@Traders.com. SUGGESTED READING Prophet Financial Current and past articles from Working Money, The Investors' Magazine, can be found at Working-Money.com.
|
Technical Writer for Technical Analysis of STOCKS & COMMODITIES magazine, Working-Money.com, and Traders.com Advantage.
| Title: | Traders.com Technical Writer |
| Company: | Technical Analysis, Inc. |
| Address: | 4757 California Avenue SW |
| Seattle, WA 98116 | |
| Phone # for sales: | 206 938 0570 |
| Fax: | 206 938 1307 |
| Website: | www.traders.com |
| E-mail address: | DPenn@traders.com |
Traders' Resource Links | |
| Charting the Stock Market: The Wyckoff Method -- Books | |
| Working-Money.com -- Online Trading Services | |
| Traders.com Advantage -- Online Trading Services | |
| Technical Analysis of Stocks & Commodities -- Publications and Newsletters | |
| Working Money, at Working-Money.com -- Publications and Newsletters | |
| Traders.com Advantage -- Publications and Newsletters | |
| Professional Traders Starter Kit -- Software | |
PRINT THIS ARTICLE

Request Information From Our Sponsors
- StockCharts.com, Inc.
- Candle Patterns
- Candlestick Charting Explained
- Intermarket Technical Analysis
- John Murphy on Chart Analysis
- John Murphy's Chart Pattern Recognition
- John Murphy's Market Message
- MurphyExplainsMarketAnalysis-Intermarket Analysis
- MurphyExplainsMarketAnalysis-Visual Analysis
- StockCharts.com
- Technical Analysis of the Financial Markets
- The Visual Investor
- VectorVest, Inc.
- Executive Premier Workshop
- One-Day Options Course
- OptionsPro
- Retirement Income Workshop
- Sure-Fire Trading Systems (VectorVest, Inc.)
- Trading as a Business Workshop
- VectorVest 7 EOD
- VectorVest 7 RealTime/IntraDay
- VectorVest AutoTester
- VectorVest Educational Services
- VectorVest OnLine
- VectorVest Options Analyzer
- VectorVest ProGraphics v6.0
- VectorVest ProTrader 7
- VectorVest RealTime Derby Tool
- VectorVest Simulator
- VectorVest Variator
- VectorVest Watchdog

