HOT TOPICS LIST
- Strategies
- Stocks
- Buy
- Investing
- Brokers
- Psychology
- Interviews
- Accumulate
- Sell
- Hold
- Spotlight
- Websites
- Candlestick Corner
- Gold & Metals
- Options Trading
LIST OF TOPICS
THE CHARTIST
Gann Can Cycle
09/26/05 11:54:15 AM PSTby Aaron Lynch
As W.D. Gann emphasized, understanding market timing will only assist you if the other fundamentals are in place.
| When I was first developing my capabilities in technical analysis, I did typical novice technician things. I found that most charting packages included the standard technical indicators, and all I had to do was to master their use. Moving average convergence/divergence (MACD) indicators and the relative strength index (RSIs) were a way to project or "predict" an upcoming move. It was around this time that I heard about time cycles, seasonality, and W.D. Gann. Though I was initially one of many to distance myself from terms like "forecasting," I soon started to reappraise Gann's work and look for repetition of price, as well as time frames, particularly those operating in the light sweet crude contract. The oil contract is the most heavily traded on the planet, and it affects our economy on a broad scale... not to mention every person driving a vehicle. SEASONALITY & CYCLES Over the years, traders have established and relied on a variety of techniques to identify time cycles within a market. The most famous practitioner of this analytical style is the 20th-century trader W.D. Gann. Gann broke down his studies into price- and time-based analysis. These two broad concepts rely on a simple premise: "History repeats." Many accept this statement in other facets of life, so why should the financial markets be any different?
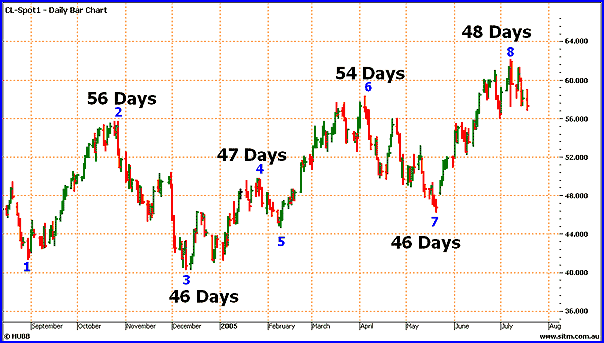
GANN ANALYSIS ON OIL One of Gann's techniques was to measure in time the difference between lows and highs to locate repeating time frames. He examined specific time frames, but in our case we will keep it simple by working with what the market has given us. It is possible for a given market to deliver the same time frames every time, but we are happy to work within a day or two when assessing timing in a market. Figure 1 provides a historical snapshot of the oil market and, more important, its turning points. This figure shows labeled turning points 1 through to 8. Using Gann's method to measure days between these lows and highs, we can see some similar time frames. The major similarities are in the bullish range (turning points 1 to 2) of 56 days and (turning points 5 to 6) 54 days. The remaining ranges can be bullish or bearish, and have all tended to complete within 46 to 48 days.
Figure 1: THE CRUDE OIL MARKET. Here you see the turning points. You'll see similar time frames between these turning points. CYCLES WITHIN MARKETS
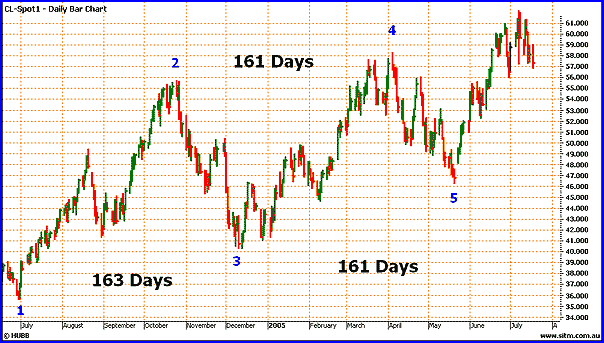
Figure 2: WHAT WORKS ON A SMALL SCALE WILL ALSO WORK ON A LARGE ONE. Here the time interval between turning points was very similar.
The balancing of time was a useful tool propounded by Gann, and I have labeled Figure 2's turning points 1 through 5. Measuring between points 1 and 3, the time frame was 163 days; between points 2 and 4, it was 161 days; and finally, between points 3 and 5, it was exactly 161 days. It is more than coincidence that point 5 was May 20 this year and the 161-day cycle repeated. This was also the same day as point 7 in Figure 1, or a repeat of the 46-day cycle. What we see here are time frames lining up, forming a cluster. Based on these time frames, I have given you more than enough information to put together your own forecast. Some may say that this is where the hard work ends, but identifying cycles is one thing and trading them is another. As W.D. Gann emphasized, understanding market timing will only assist you if the other fundamentals are in place; he detailed a way to trade these turns using swing charts, stop-losses, and a strong focus on money management. Interpreting the markets with chart analysis can tell you many things, especially when you look in the right place. True, price is a critical element to success, but the time axis and cycles occurring in a market are equally important in making a better trading decision. Good trading!
Aaron Lynch is a trader and general manager of Safety In The Market (www.sitm.com.au), one of Australia's longest-running investment training organizations that educates traders around the world on the importance of a structured approach to trading. Current and past articles from Working Money, The Investors' Magazine, can be found at Working-Money.com.
|
| Title: | General Manager |
| Company: | Safety In The Market |
| Website: | sitm.com |
Traders' Resource Links | |
PRINT THIS ARTICLE

Request Information From Our Sponsors
- StockCharts.com, Inc.
- Candle Patterns
- Candlestick Charting Explained
- Intermarket Technical Analysis
- John Murphy on Chart Analysis
- John Murphy's Chart Pattern Recognition
- John Murphy's Market Message
- MurphyExplainsMarketAnalysis-Intermarket Analysis
- MurphyExplainsMarketAnalysis-Visual Analysis
- StockCharts.com
- Technical Analysis of the Financial Markets
- The Visual Investor
- VectorVest, Inc.
- Executive Premier Workshop
- One-Day Options Course
- OptionsPro
- Retirement Income Workshop
- Sure-Fire Trading Systems (VectorVest, Inc.)
- Trading as a Business Workshop
- VectorVest 7 EOD
- VectorVest 7 RealTime/IntraDay
- VectorVest AutoTester
- VectorVest Educational Services
- VectorVest OnLine
- VectorVest Options Analyzer
- VectorVest ProGraphics v6.0
- VectorVest ProTrader 7
- VectorVest RealTime Derby Tool
- VectorVest Simulator
- VectorVest Variator
- VectorVest Watchdog


