HOT TOPICS LIST
- Strategies
- Stocks
- Buy
- Investing
- Brokers
- Psychology
- Interviews
- Accumulate
- Sell
- Hold
- Spotlight
- Websites
- Candlestick Corner
- Gold & Metals
- Options Trading
LIST OF TOPICS
THE OPTIMIZED TRADER
BOSO
10/05/05 01:06:41 PM PSTby David Penn
Buying the overbought and selling the oversold.
| Traders have heard or read it more times than they can count: some sharp-eyed market analyst pronouncing, "Watch out, you bulls, this market is getting pretty overbought... you don't want to be chasing it!" The converse ("Beware of those oversold readings, you bears!") is probably heard only slightly less often. But how good is this advice, really? In some commonsensical way, this advice is completely understandable. After all, you wouldn't continue to cook a steak that was overdone, would you? (Actually, I have a former colleague who would do just that, but I digress.) If a market is overbought and you aren't long, then — sorry, sports fans — you missed the move. You have to wait for the overbought condition to wear itself out. A similar problem confronts those looking to short assets that have already become oversold. One of my favorite bits of trading wisdom comes from none other than Jesse Livermore, who in Reminiscences Of A Stock Operator observes that "stocks are never too high to buy and never too low to sell." For anyone who has watched asset prices move — be they stocks, currencies, futures, or other tradables — this is no less commonsensical than the idea that you should never buy an overbought market, even if the two ideas are mutually exclusive. When you think of it, every stock that is at 75 was at 60 once, and was at 45 and 50 sometime before that. To look at a stock and insist that it cannot go any higher because too many people have already bought it is a presumption that the profitable trader cannot always make.
GETTING OVER THE "OVER" I won't repeat the entirety of Headley's methods here, but the basic notion that overbought and oversold markets can still be bought and sold, respectively, is one that seems important enough to share. To that end, I will leave out the specific entry and exit criteria that Headley showed seminar attendees and focus instead on showing what markets actually do when they become overbought or oversold, rather than what myth and legend suggest markets should do in these circumstances. One of the more basic tools for determining whether a market is overbought or oversold is the stochastic. Any oscillator, from the relative strength index (RSI) to the moving average convergence/divergence (MACD), can serve in this role, but the stochastic is common enough to make it one of the most frequently used tools to determine whether a market has moved "too far, too fast" to the upside or the downside. The stochastic oscillator, as Steven Achelis reminds us in his Technical Analysis From A To Z, "compares where a security's price closed relative to its price range over a given time period." Among what Achelis calls the "popular methods" for interpreting the stochastic oscillator, the only one that refers to the oscillator's overbought and oversold readings encourages traders to buy when the stochastic falls into the oversold territory and then rises out of it. This is an example of the way most traders deal with overbought and oversold situations — essentially, selling the overbought and buying the oversold. There is one technical problem with this approach: over time, you are too often betting against the trend. Traders who attempt to sell overbought markets and buy oversold ones may not believe they are making trades riskier as opposed to less risky. But that is the case in many ways. In range-bound markets, this kind of top-picking and bottom-feeding can make a great deal of sense; indeed, it might be the only way to make money in certain markets. But some of the traditional ways of trading based on overbought and oversold signals are as risky as some of the top- and bottom-picking approaches that traders might otherwise avoid. The sooner these traders and speculators realize this potential risk, the sooner they are able to take advantage of both the trend and the obvious fear many traders have of the trend — that is, the fear that the day they enter on the side of the trend, it will reverse.
BAND BUSTING
Standard deviation is a statistical concept that describes how a set of data [prices] is dispersed [spread] around an average value. The concept of standard deviation has a very specific value in statistics. That is because 68 percent of the data values differ from the middle average by less than one standard deviation. Ninety-five percent of the data values differ from the middle average by less than two standard deviations. Since the Bollinger bands are placed two standard deviations above and below the 20-period moving average, 95 percent of all price action should be contained by the two bands. However, there is an interesting tendency in the use of Bollinger Bands that, while similar to the one used with stochastics (as discussed), also runs somewhat counter to the notion of buying the overbought and selling the oversold. Again, as Murphy says:
The interpretation is the same, however. Prices will usually meet resistance at the upper band and support at the lower band. The simplest way to interpret Bollinger bands is that the upper band represents overhead resistance, while the lower band represents support below.
Of course, careful readers will note that there is a problem with this. While 95% of price action might be contained in a Bollinger Band, it is that 5% that actually makes trends possible; otherwise, prices would simply oscillate, a little higher now, a little lower later, in the way that many academics who embrace the random walk thesis suggest. But anyone who has looked at a price chart (or, perhaps more important, anyone who has ever traded the markets) knows that the exceptional 5% occurs quite often as stocks break out of trading ranges or make bottoms and reverse to move higher, and so on. So while it is reasonable to depict the upper and lower boundaries of a Bollinger Band as resistance and support, it is also important to realize that that resistance and support are not inviolate, not any more than regular resistance and support on a price chart are. This becomes immediately apparent when approaching markets from a BOSO perspective. In fact, rather than limiting price action at its upper and lower boundaries, Bollinger Bands often give way quite readily when faced with an overbought or oversold market. When you think about it, from the perspective of the Bollinger Bands, new price extremes are simply added back into the mix as the Bollinger Band expands to make the new outrageous prices part of the 95%, rather than part of the 5%.
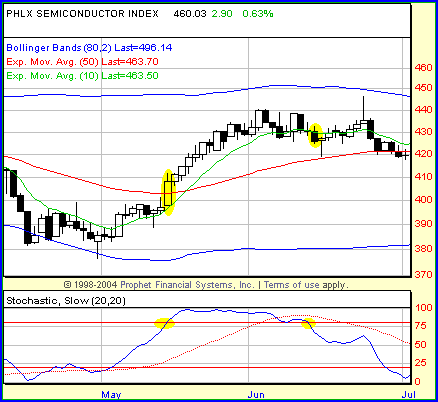
BOSO IN ACTION I've also found the BOSO approach particularly worthwhile for those instances when a market appears to have already moved beyond the sort of entry points produced by swing or buy-the-pullback oriented trading setups and methodologies. Last night, for example, I found myself caught unawares by a move in the EUR/USD. I switched from time frame to time frame, trying to find one that — viewed through any one of my favorite trading setups — would provide a clear entry (and exit rules if my judgment proved wrong). No dice — until I rolled out the BOSO screen. Voila! There on the 15-minute chart was a BOSO short opportunity. Again, I'm not going to get into specific entry and exit rules. But I think a review of how a variety of markets have behaved when shown against a BOSO screen will provide plenty of grist for your analytic mill. First, let's take a look at the daily chart of the Philadelphia semiconductor sector ($SOX). I like to find a top or bottom — as suggested by a negative or positive divergence in the stochastic — and then look for a move toward the opposite Bollinger Band. In the case of the $SOX in Figure 1, there is a positive stochastic divergence in April that — along with the tendencies in the broader market — suggested a bottom. Shortly after this, while the $SOX began moving sharply higher, the stochastic oscillator was moving all the more sharply.
Figure 1: $SOX, May-June BOSO long. Coming up off an intermediate-term bottom, the $SOX signals a buying opportunity as its stochastic crosses into overbought territory in mid-May. Profitable exits appear within two weeks and again within four.
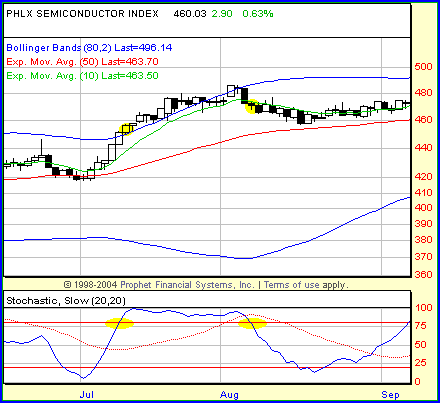
The stochastic broke out into overbought territory with the daily $SOX close of 411.11 on May 16. Over the next two weeks, during which the $SOX was dangerously oversold, the semiconductor index rallied to just over 440 (the June 2nd close of 440.07). During the same period, the SMH (the semiconductor HOLDRS) rallied from a closing price of 32.93 to a closing price just north of 35. An even more dramatic example of the BOSO approach came in July. As you can see in Figure 2, the $SOX slipped from its overbought condition on June 14, on a day when the index closed at 425.65 (still profitable vis-à-vis an entry on May 16). Moving largely sideways in June and July, the $SOX again broke out into overbought territory on July 12 with a close of 451.60. Again, about two weeks later, the $SOX was significantly higher. For example, by the close of August 2, the $SOX was 486.20. About a week later on August 8, the same day the $SOX slipped from its overbought status, the close was 465.86.
Figure 2: $SOX, July-August BOSO long. Often the second move into overbought or oversold territory is the most profitable move to trade. Here a move into the overbought in mid-July provides excellent profit-taking opportunities in about two weeks' time.
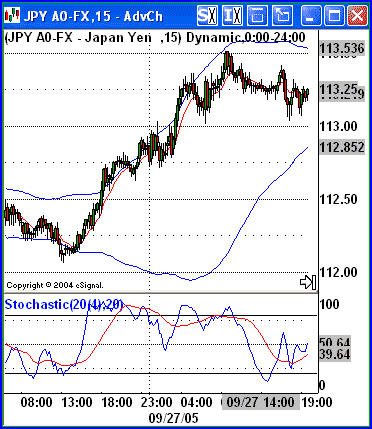
There's something else to note about this last move in the $SOX. When the overbought breakout occurred on July 12, the $SOX closed for its second day above the upper boundary of the Bollinger Band (I should add here that the Bollinger Bands used with the BOSO approach are especially long in duration. Whereas the standard Bollinger Band references 20 periods, these collect data for the past 80 periods). Clearly, the upper Bollinger band was not providing much resistance! The $SOX went on to make an additional 10 closes above the upper band. A trader trying to fade this powerful move higher would have been short-squeezed beyond all recognition. It is this kind of enduring outperformance that drives trends — both to the upside and to the downside. Let's take a quick look at another market. I mentioned relying on the BOSO approach to buying overbought and selling oversold markets when recently dealing with an opportunity in the foreign exchange market. I also mentioned the notion that BOSO was time frame-agnostic. Looking at the USD/JPY, this example will provide an interesting example of both. Consider the 15-minute chart of the USD/JPY in Figure 3. Keying off the potential for a bottom as suggested by the positive stochastic divergence during the morning of September 26, USD/JPY made a stochastic breakout into overbought territory around 16:30 (4:30 pm) that day. Followthrough to the upside is immediate, so the BOSO trader is long near 112.39. As the stochastic remains overbought, USD/JPY continues to climb. Note here also how the 10-bar exponential moving average (EMA) — a moving average appreciated by short-term traders like Marty Schwartz (see his comments on the 10-day EMA in his excellent trader's biography, Pit Bull) — effectively provides support for the rallying USD/JPY until just before the stochastic slips from its overbought levels late in the evening of September 26.
Figure 3: USD/JPY. This chart of the 15-minute USD/JPY shows not only a BOSO long entry on the afternoon of the September 26, but also shows how without followthrough to the downside, pullbacks are little more than opportunities to increase position size. A day later, this trade was an 80+ pip gainer.
However, even though the stochastic slips below 80 (the standard demarcation between overbought and not overbought), there is no followthrough to the downside. Because of this, buyers remain encouraged and USD/JPY pops higher. The stochastic slips again from overbought territory not long afterward, but again, the aggressive bears are nowhere to be found, so the USD/JPY bumps higher still. This pattern takes place again early in the morning of September 27: The stochastic slips from the overbought area, yet there is no significant selling in the USD/JPY and the currency pair heads higher. So when does this party end? Just before noon on September 27. Here the stochastic slips once again from the overbought area. This time, however, there is significant selling that drags the USD/JPY lower as the stochastic continues to move lower. An exit around 11:45 — just as this significant selling is making itself apparent — would have meant closing out the position near 113.25, providing an 80-odd point move in less than 24 hours.
OTHER OSCILLATORS, BETTER BANDS As I noted at the outset, my own awareness of the validity of buying overbought markets and selling oversold ones came courtesy of Price Headley, author and trader with BigTrends.com. To this end, I encourage those who find this concept intriguing to not only seek out more of Headley's work, but also to make explorations into the concept — and, what's more important, the reality — of the overbought and oversold conditions in the marketplace. Instead of stochastics, try tracking the market with the RSI or MACD and compare the results. Instead of Bollinger Bands, consider moving average envelopes or even trend channels to highlight when an asset is making an outsized move. For me, what has been most helpful about the BOSO approach is that it runs counter to most of the swing-trading oriented setups and methods that I have used. Sometimes (if not often), a market will not bend to your will, and instead will move, gyrate, and contort itself as if to deliberately avoid the neat little setups you have prepared for it. In such instances, rather than abandoning all hope of making a successful trade, a trader with a different set of rules to take advantage of different trading situations can truly optimize his or her trading. To steal a phrase, there ain't no mountain high enough and ain't no valley low enough to keep a flexible and creative trader away from profits when there are profits to be had.
David Penn may be reached at DPenn@Traders.com.
SUGGESTED READING Prophet Financial Systems Current and past articles from Working Money, The Investors' Magazine, can be found at Working-Money.com. |
Technical Writer for Technical Analysis of STOCKS & COMMODITIES magazine, Working-Money.com, and Traders.com Advantage.
| Title: | Traders.com Technical Writer |
| Company: | Technical Analysis, Inc. |
| Address: | 4757 California Avenue SW |
| Seattle, WA 98116 | |
| Phone # for sales: | 206 938 0570 |
| Fax: | 206 938 1307 |
| Website: | www.traders.com |
| E-mail address: | DPenn@traders.com |
Traders' Resource Links | |
| Charting the Stock Market: The Wyckoff Method -- Books | |
| Working-Money.com -- Online Trading Services | |
| Traders.com Advantage -- Online Trading Services | |
| Technical Analysis of Stocks & Commodities -- Publications and Newsletters | |
| Working Money, at Working-Money.com -- Publications and Newsletters | |
| Traders.com Advantage -- Publications and Newsletters | |
| Professional Traders Starter Kit -- Software | |
PRINT THIS ARTICLE

|

Request Information From Our Sponsors
- StockCharts.com, Inc.
- Candle Patterns
- Candlestick Charting Explained
- Intermarket Technical Analysis
- John Murphy on Chart Analysis
- John Murphy's Chart Pattern Recognition
- John Murphy's Market Message
- MurphyExplainsMarketAnalysis-Intermarket Analysis
- MurphyExplainsMarketAnalysis-Visual Analysis
- StockCharts.com
- Technical Analysis of the Financial Markets
- The Visual Investor
- VectorVest, Inc.
- Executive Premier Workshop
- One-Day Options Course
- OptionsPro
- Retirement Income Workshop
- Sure-Fire Trading Systems (VectorVest, Inc.)
- Trading as a Business Workshop
- VectorVest 7 EOD
- VectorVest 7 RealTime/IntraDay
- VectorVest AutoTester
- VectorVest Educational Services
- VectorVest OnLine
- VectorVest Options Analyzer
- VectorVest ProGraphics v6.0
- VectorVest ProTrader 7
- VectorVest RealTime Derby Tool
- VectorVest Simulator
- VectorVest Variator
- VectorVest Watchdog


