HOT TOPICS LIST
- Strategies
- Stocks
- Buy
- Investing
- Brokers
- Psychology
- Interviews
- Accumulate
- Sell
- Hold
- Spotlight
- Websites
- Candlestick Corner
- Gold & Metals
- Options Trading
LIST OF TOPICS
TRADER'S NOTEBOOK
The Effect Of Tilt On Mutual Fund Investing
10/07/05 01:22:05 PM PSTby Norman J. Brown
Overcome invisible limits and find your own positive tilt.
| In my earlier studies of equity mutual funds, I found it perplexing that the returns of buy and hold (BH) investing are considerably lower than those of up bias (number up days per trading year) and average up-day returns ("A Mutual Fund Trading Method," S&C, June 2003). I was surprised to find that results from the One Rank (OR) switching technique that I advanced were, happily, in excess of that predicted ("Serial Correlation Of One Rank," S&C, October 2003). In this article, I will systematically explore a large sample of such mutual funds to try to understand the factors causing these two phenomena. The analysis was performed using FastTrack (FT) and Excel software, studying 120 mutual funds that existed for at least 10 years in the FT database. A key parameter from my earlier studies was designated as "tilt" and will be shown to be critical in understanding the characteristics of both buy and hold and one-rank investing.
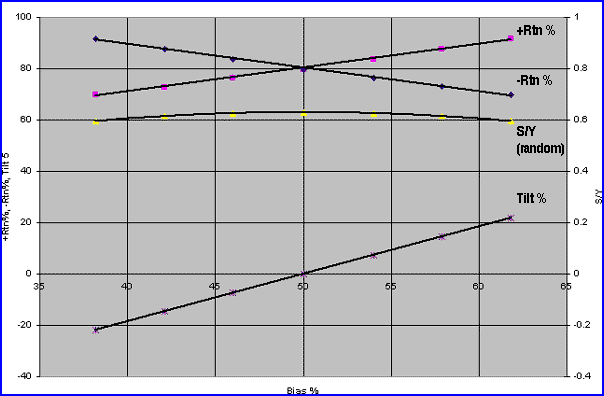
A DISCUSSION OF TILT In Figure 1, you see a plot of seven random series using bias (B) as the variable and holding the standard deviation (STD) constant at 1.0%. The bias is created by adding or subtracting an offset ROC to the mean ROC (which is zero for an equally biased distribution). The four outputs are essential to understanding the followthrough on studies to be performed on actual mutual funds.
Figure 1: Random series: +Rtn, -Rtn, S/Y, Tilt (Std. = 1.0%).
At the top of the graph is the positive return (+Rtn) that represents the average positive ROC of about 0.8% (from statistics, it is precisely given by the square root of 2 divided by pi or 0.7979) and would scale directly with an increasing value of the standard deviation. Note that the -Rtn has the mirror opposite slope. Subtracting the -Rtn from the +Rtn results in the tilt we will be discussing. At the bottom of the graph, this tilt is directly proportional to B and increases to nearly 0.2% at a B of 60%. It should be noted that a 60% biased "fair coin" is random in the same sense as a 50/50 fair coin; neither retain memory of a prior coin toss. A good example of this is a roulette wheel, which is completely random in behavior except for the house bias built in with an extra, nonpaying position. The graph of S/Y (number of switches per year; see references above for more details) for this random coin range is surprising in that it does not go above 63 and is fairly flat (it can be calculated from my earlier formula as Sr = N * B * (1-B) where N is 252 trading days in a year). (Sr is random switching rate.) Subsequent data will show that the majority of equity mutual funds is well below that curve and, in a serial correlation sense, can be identified as nonrandom in nature.
LOOKING AT EQUITY MUTUAL FUNDS Some simple calculations can yield insight into the effects of both positive and negative tilt on BH investing. Let's suppose that the fund is truly random with a fair-coin bias of 50% and a symmetrical (Gaussian bell-shaped) ROC. Further, let's assume that the daily standard deviation (Std.) is 1.4% (suggesting that the bell-shaped ROCs will range from -3 Std. to +3 Std. or from -4.2% to +4.2% with a mean ROC of zero) and the up-day ROC is 1.0% and the down-day ROC is -1.0% (actual 1/1.01 or -0.9901% is needed, but -1.0% is close enough). Over a year (252 investing days), the BH return would be:
Equation 1BH = (1.01) ^126 * (1/1.01)^126 = 1.0 or Ann = 0%
Now, let's assume a more practical nonrandom case with an up bias at a typical 55% and retaining the same ROC values as above:
Equation 2BH = (1.01) ^138.6 * (1/1.01)^113.4 = 1.285 = 28.5% Ann
For this nontilt case, equation 2 can be expressed by the net up-days over that of the down-days:
Equation 3BH = (1 + Rtn+) ^ N(2B-1) = (1.01) ^ 25.2 = 1.285 as above
Thus, the BH investor can make money if the bias is greater than 50%, even if the down-day loss is exactly offset by the up-day loss. Most BH investors strive for these net positive days and usually don't have a quantitative sense of whether (on average) the up-day ROCs really exceed the down-day ROCs. In the real world of equity mutual funds, it is rare that the average up-day ROC equals the down-day ROC. Later, we will further explore the tilt that will inevitably be created in this unsymmetrical (nonrandom) case, For now, however, let's explore a fund that has the same 55% bias and 1.0% positive return, but where the average down-day return is not -1.0%, but slightly more at -1.1%. What effect does this extra tilt of -0.1% have on the previous BH return?
Equation 4BHT = (1.01) ^135.6 * (1/1.011) ^ 113.4 = 1.149 = 14.9% Ann
Ouch! Our very nice 28.5% return has been cut in half by a small negative tilt increase in the downday ROC. A good approximation to buy and hold with tilt (BHT) and bias > 50% is:
Equation 5BHT = BH *(1+T)^ N(1-B) = BH*(1/1.011)^113.4= BH*.893
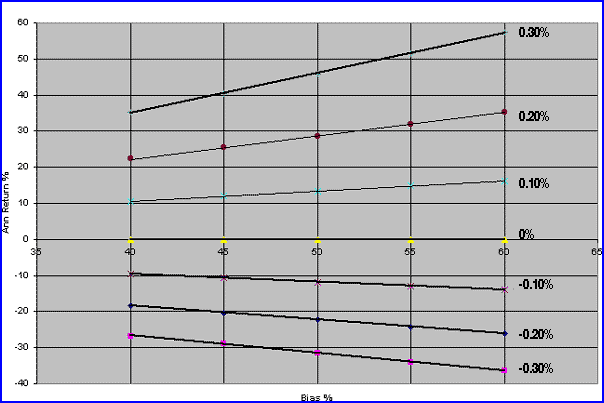
Thus, the nontilt 28.5% gain is reduced by a -10.7% tilt to a net 14.9%, a most discouraging reduction. Conversely, you could imagine a positive tilt of 0.1% with a very desirable improvement of 1.001^113.4=1.12, increasing the BH return of 28.5% to an excellent 43.9% return. Unfortunately, my studies of equity mutual funds have indicated that 65% of all such funds have a negative tilt; out of the other 35%, half have a negligible positive tilt, which turns out to be less than 0.02%. Still more discouraging is that the few funds with a significant positive tilt have a bias near 50% (some even less), so their nontilt return is near zero, or negative. So, the effects of the positive tilt are negated. Thus, the BHT gain, with tilt, is multiplied by the [1+T] ^ N(1-B) term. A graph of the tilt portion of this equation is given in Figure 2.
Figure 2: Annualized tilt return vs. bias for various levels of tilt.
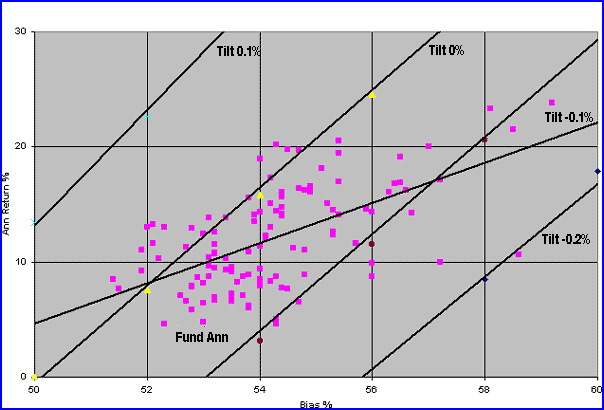
It is obvious that even small negative tilt values can have a devastating effect on BH performance, and the effect is worse for biases greater than 50%. Subsequently, this small effect is key to the suppressed BH returns and for the enhanced OR returns. Combining those tilt equations with the data taken in FT for 140 equity mutual funds over a recent 10-year period results in Figure 3. Although there is some scatter in the data for the funds returns (all Anns were normalized to that given by a fund with a standard deviation of 1.0 to eliminate that variable from the data), it is obvious that much of the returns fall below the zero tilt line, leading to the previously mentioned deterioration in BH returns compared to that with the tilt nearer zero. This is counterintuitive when we see that a random fund (or series) will always have increased return (linearly) as the bias increases — which, in turn, always increases the tilt. Investors intuitively sense that successful BH fund holdings depend on more up than down ROC days, but probably aren't aware just how significantly their portfolio returns can be degraded by excess down-day ROCs.
Figure 3: Annualized BH return (normalized to Std. = 1.0) vs. bias for various levels of tilt. This test was performed on 140 equity mutual funds from December 1, 1994, to December 1, 2004.
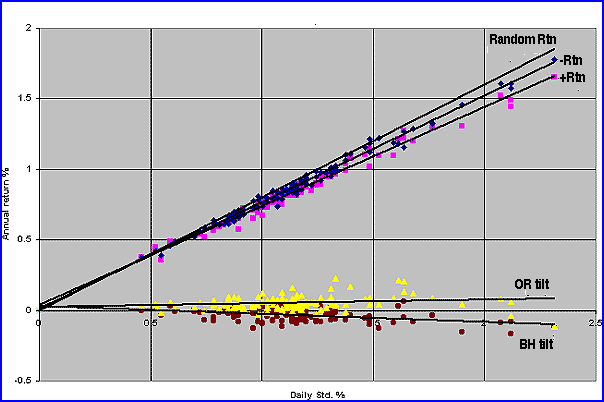
So we are faced with the inherent negative tilt within these type of funds (minus leaning ROC symmetry) that considerably reduces the BH Ann for a given level of bias and Std. Figure 4 shows the case for BH, indicating that the -Rtn is slightly less than what you can expect from a random fund of the same B and Std. But most disconcerting is that the +Rtn data is below the -Rtn data, leading to the dreaded negative tilt shown at the extreme bottom of the figure. For comparison purposes, the OR tilt is plotted above the line as a majority of the values are positive, leading to a favorable plus tilt for that technique. Further, note that all five parameters are a linear function of the Std., indicating the importance of that parameter in enhancing the returns.
Figure 4: BH +Rtn & -Rtn, random Rtn, BH tilt, OR tilt vs. Std. 140 equity mutual funds, December 1, 1994, to December 1, 2004.
LOOKING FOR OR CHARACTERISTICS Trade Day BH ROC% OR ROC%
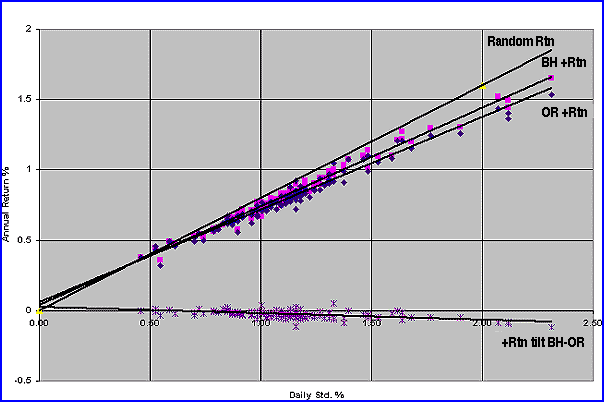
As day 1 is the first up-day, it is an OR buy. However, as it occurs at the end of the day, that day is "lost," as we were previously out of the market or in money markets (MM). The up-days have been reduced by one switch (buy) event; at best, the day lost would ideally have a value less than the up-day average to preserve the up return as much as possible (in fact, it is usually the opposite, as indicated by the 1.1% ROC). If you now measure the OR average up return and find it to be less than the BH up average, call that a negative day tilt and attribute it to the buy process. Conversely, note that the negative days translate to a single down-day return after each sell. Hopefully, that is a low value of negative ROC (as indicated by the low -0.8% ROC) to preserve the higher ones to be switched into MM. Thus, if you measure the OR average down-day return and it is less negative than the starting BH negative ROCs, that is an advantage and we designate it as a positive tilt. In passing, I should emphasize that the sell process yielding a single negative ROC (at each S/Y) is the key to breaking up long strings of down-days that can lead to onerous and scary drawdowns for the BH investor. If you look at Figure 5, you can see that the OR process creates an OR +Rtn that is less than the BH +Rtn, leading to the negative tilt shown at the bottom of the figure. It can also be said, therefore, that the OR buy day is unfavorable, as it is of greater magnitude than an average BH up ROC.
Figure 5: BH +Rtn, OR + Rtn, +Rtn tilt (BH OR) 140 equity mutual funds, December 1, 1994, to December 1, 2004.
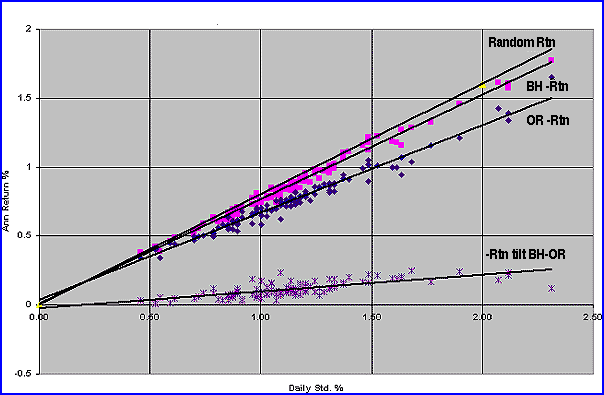
In Figure 6, things are much more favorable. The OR -Rtns are less than the BH -Rtns, so the OR sell process occurs on a low negative day (on average), dumping the larger negative ROCs into MM, to our considerable advantage.
Figure 6: BH Rtn, OR Rtn, random Rtn, -Rtn Tilt (BH OR) 140 equity mutual funds, December 1, 1994, to December 1, 2004.
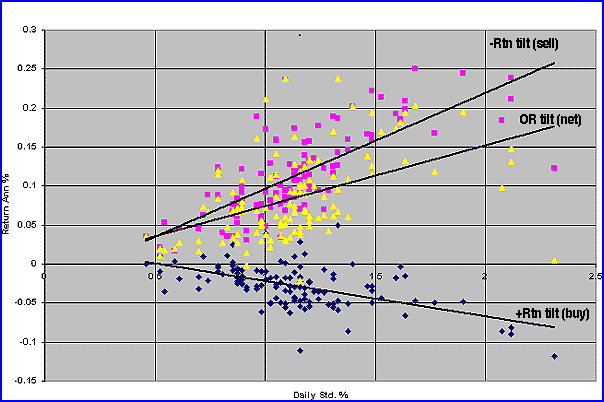
As a direct measure of the effectiveness of the OR process on buying and selling, Figure 7 compares their respective tilts to one another. The OR tilt net is the difference between the unfavorable buy tilt and the exciting sell tilt, leading directly to the greatly enhanced OR performance compared to the compressed BH performance. Remember, the BH is suppressed by the negative BH tilt while the OR performance is pushed up beyond the theoretical no-tilt level expected. All this represents a double improvement (overcoming the BH negative tilt and adding on top a further positive OR tilt).
Figure 7: OR +Rtn tilt (Buy) OR Rtn tilt (sell), net OR tilt vs. daily Std. 140 equity mutual funds, December 1, 1994, to December 1, 2004.
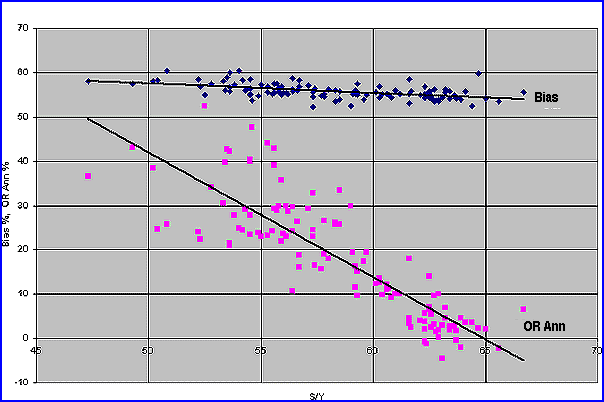
Figure 8 summarizes the OR Ann for the 120 mutual funds as a function of S/Y, showing the strong effect of low S/Y (long fund persistence) on improving Ann to values well above BH (as discussed in my previous articles). Not so obvious is the slight dropoff in B, as S/Y increases toward the dreaded 63 random-like value. Note also that in the case of funds with S/Y above 63 (random-like level), the Ann return is either negative or negligible.
Figure 8: Bias, OR Ann return vs. S/Y. 140 equity mutual funds, December 1, 1994, to December 1, 2004.
It should be made clear that the OR evaluation performed on the 120 funds was for the purpose of diagnostic insight into the OR process. Because of the widespread prohibition of rapid switching (by the mutual fund firms), traders who want to investigate with OR-type switching must rely on everyday switching capabilities from firms such as Rydex, ProFunds, or Potomac.
CONCLUSIONS Building on my previous explorations into trading methods in mutual funds, studying 120 equity mutual funds reestablishes that the BH investor is penalized by a largely unseen parameter: negative tilt. His hard-earned returns are compressed downward by a significant factor (the order of -11% per 0.1% tilt). Unfortunately, this seems to be an inherent trait of such funds, and there doesn't seem to be anything he can do about it (other than selecting successful funds to invest in, of course). The OR technique performs extraordinarily well as the action of selling (generally) on a larger ROC down-day creates a substantial positive tilt. In turn, this creates an Ann return that can exceed the theoretical gain based only on net up-days. Coupled with the fact that it is overcoming the BH negative-tilt suppressed Ann, the OR approach seems to offer an interesting alternative for those investors with the time and skill to implement it.
Norman J. Brown is a retired electrical engineer and private investor. He may be reached at njb.nb@verizon.net.
SUGGESTED READING
Current and past articles from Working Money, The Investors' Magazine, can be found at Working-Money.com.
|
Norman J. Brown is a retired electrical engineer and private investor. He may be reached at njb.nb@verizon.net.
| E-mail address: | njb.nb@verizon.net |
PRINT THIS ARTICLE

Request Information From Our Sponsors
- StockCharts.com, Inc.
- Candle Patterns
- Candlestick Charting Explained
- Intermarket Technical Analysis
- John Murphy on Chart Analysis
- John Murphy's Chart Pattern Recognition
- John Murphy's Market Message
- MurphyExplainsMarketAnalysis-Intermarket Analysis
- MurphyExplainsMarketAnalysis-Visual Analysis
- StockCharts.com
- Technical Analysis of the Financial Markets
- The Visual Investor
- VectorVest, Inc.
- Executive Premier Workshop
- One-Day Options Course
- OptionsPro
- Retirement Income Workshop
- Sure-Fire Trading Systems (VectorVest, Inc.)
- Trading as a Business Workshop
- VectorVest 7 EOD
- VectorVest 7 RealTime/IntraDay
- VectorVest AutoTester
- VectorVest Educational Services
- VectorVest OnLine
- VectorVest Options Analyzer
- VectorVest ProGraphics v6.0
- VectorVest ProTrader 7
- VectorVest RealTime Derby Tool
- VectorVest Simulator
- VectorVest Variator
- VectorVest Watchdog

