HOT TOPICS LIST
- Strategies
- Stocks
- Buy
- Investing
- Brokers
- Psychology
- Interviews
- Accumulate
- Sell
- Hold
- Spotlight
- Websites
- Candlestick Corner
- Gold & Metals
- Options Trading
LIST OF TOPICS
INTERMARKET ANALYSIS
Gold Tops: Then And Now
10/17/05 12:32:37 PM PSTby David Penn
A look at the 1987 peak in gold suggests that the barbaric relic remains in bull market mode in 2005.
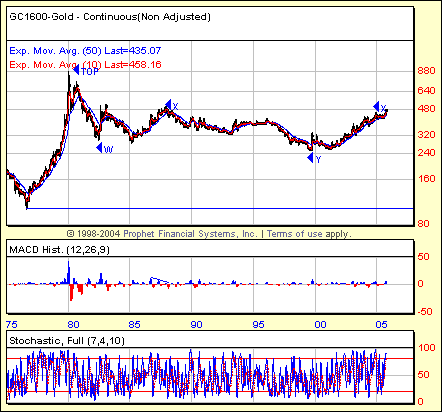
| I've long subscribed to the thesis that gold has a major cyclical move to the downside to go before any big secular bull market in gold can take place — especially the one that many gold bugs and precious metals analysts have been calling for. My reasons are both fundamental and technical — and have been well chronicled in a variety of Working-Money.com articles over the past few years. In an economy as debt-besotted as our global economy is, any hyperinflation such as the one that many gold bulls are anticipating would be something akin to having your cake and eating it, too. As demented as it must sound to anyone who lived through the inflation of the 1970s, which, as bad as it was, never rose to the level of hyperinflation, a real ramp-up in inflation would be a gift — allowing hundreds of thousands of debtors to repay their bills with cheaper dollars — and I'm just not convinced we are that lucky. My technical reasons are largely — though not wholly — Elliott wave-influenced. In a manner similar to crude oil, gold has been in a secular bear market for some 20-odd years, ever since its peak prices in 1979-80 (Figure 1). To my mind, crude oil differs from gold insofar as I believe that crude oil's secular bear market retraced enough of the previous secular bull market.
FIGURE 1: Gold has experienced a long, sideways secular bear market since its peak in the early 1980s. But there is an argument that until the bear market brings the price of gold down closer to its 1976 levels (show by the blue horizontal line), the secular bear market in gold cannot be said to have been completed.
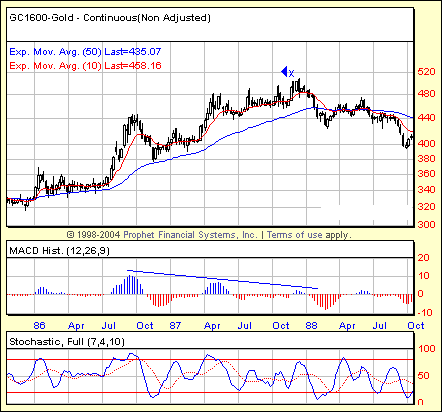
Without getting too deep into EW arcana, let me say this: During crude oil's secular advance in the 1960s and 1970s into the early 1980s, crude oil put in a wave 4 low between $10 and $15 a barrel en route to its wave 5 peak just shy of $40 in 1981. During the secular bear market that followed, crude oil twice retraced down to this level: once in 1986 and again in 1998-99. Retracements to this degree, according to Elliott wave methodology, tend to assure that all the corrective work that needs to be done will have been done. Gold, by contrast, has not experienced nearly as powerful a correction. The fourth wave low in gold's secular bull market (which spanned approximately the same duration as the crude oil secular bull market) was between $110 and $100. That low, by the way, occurred in 1976, a few years after the wave 4 low in crude oil. The current low in gold's secular bear market is roughly $250 — low especially by 2005 standards, but arguably not low enough. REMEMBRANCE OF PEAK PAST The first thing I want to look at are moving average convergence/divergence (MACD) histograms. While I am less enthusiastic about relying on MACD histogram divergences on daily charts, I have found these divergences to be quite worthwhile with weekly charts. What I want to see in looking at the 1987 top in gold are a series of smaller or shorter MACD histogram peaks in the months and weeks leading up to the 1987 top (Figure 2). This would tell me that buying momentum was waning as prices were headed higher. As far as reversals go, such trends are among the best indications — especially over the durations considered here.
FIGURE 2: Note the increasingly smaller MACD histograms as the price of gold advances through 1986 and 1987. The exceptionally high MACD histogram in the third quarter of 1986 did alert traders to higher gold prices down the line, but the smaller MACD histograms in the second and fourth quarters of 1987 were a warning that gold's golden days were all but done.
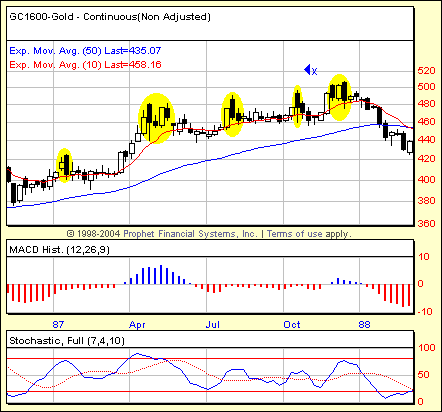
From the high in 1987 of more than $500 per ounce, the price of gold fell over the next year to levels less than half of that. Fortunately for those willing to read the technical tea leaves, the end of gold's cyclical bull market in 1987 was very much anticipated by the pattern in the MACD histogram. Over the course of gold's move from $340 to the $500 level, the MACD histograms that accompanied every rally grew shorter and less powerful on each occasion. By the time we got to the fourth quarter of 1987, the MACD histogram was barely visible above the zero line. This in and of itself doesn't mean a great deal. But in the context of the previous MACD histogram peaks earlier in 1987 and in 1986, the minimal MACD histogram peak in late 1987 couldn't have been more telling. Another interesting technical "tell" comes from the amount of distribution that was going on in the gold market throughout 1987. As Figure 3 shows in better detail than Figure 2, there were seven weekly "dark cloud cover" weeks that effectively snuffed out any attempt by buyers to push gold prices any higher. On a daily basis, "dark cloud cover" candlesticks can be powerful signals of an impending reversal. On a weekly chart, such patterns are all the more compelling.
FIGURE 3: Stormy weather, indeed! On seven different occasions in 1987, weekly dark cloud cover candlesticks stymied attempts to bid gold prices higher.
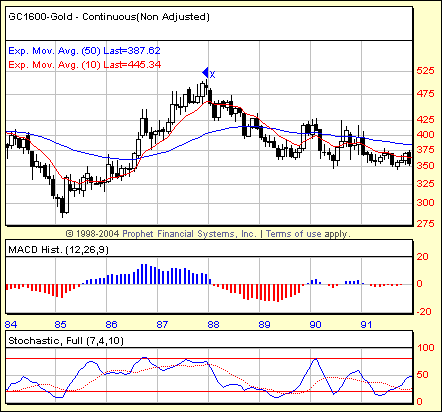
Finally, the monthly chart (Figure 4) reveals both stochastic and MACD histogram divergences that are notable. The monthly MACD histogram divergences — as with the weekly MACD histogram divergences — grow lower from late 1986 to mid-1987, and then lower still into late 1987. These divergences are tracked point-for-point by the 7,10 stochastic.
FIGURE 4: This monthly chart shows negative divergences in both the MACD histogram and in the 7,10 stochastic as gold prices soar toward $500 in 1987.
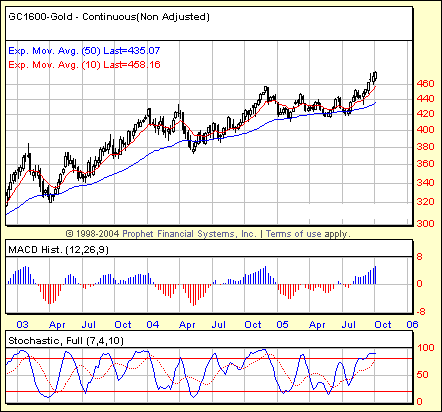
When indicators such as these are forming lower and lower highs while prices are forming higher and higher highs, a negative divergence is brewing. And while that divergence can lead to a sideways correction/bear market, such divergences can also lead to sharply lower corrections or bear markets, as well. In fact, it was this latter case that proved to be the more accurate description of what happened to the gold market from 1987 until the late 1990s. A PEAK IN GOLD NOW? So looking at the period leading up to the autumn of 2005, just what do the weekly and monthly gold charts suggest? The weekly chart of gold in recent months and years suggests little of the sort of topping action that the weekly chart of gold in the 1986-88 period did. Whereas the older weekly chart of gold clearly displayed a series of smaller MACD histogram peaks leading up to what would turn out to be the 1987 top, the weekly chart of gold looking back over the past few years shows, if anything, bullish MACD histogram trends. Note how there was a strong MACD histogram peak in the fourth quarter of 2004 (labeled "Oct" in Figure 5). If the gold market were topping in 2005, then we should expect any MACD histogram peaks after the one in fourth-quarter 2004 to be progressively lower. The next peak at the end of the second quarter of 2005 is lower, very much so, in fact. Yet the MACD histogram peak in the following quarter is, so far, every bit as robust as the one in 2004.
FIGURE 5: The rising series of MACD histogram troughs in 2005 suggests that there is not enough selling pressure to bring gold prices lower in the near term.
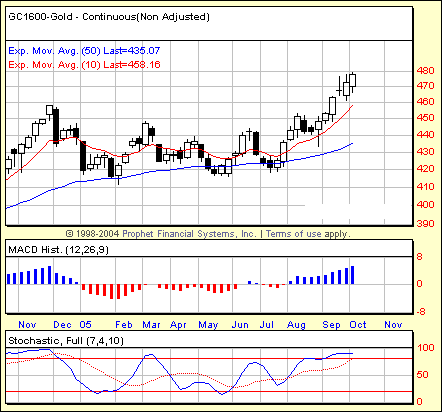
What's more, the MACD histogram troughs (in red) represent selling strength. From fourth-quarter 2004 to the present, those MACD histogram troughs become more and more shallow, suggesting less and less conviction (or ability) on the part of the sellers to lower their offers for gold. In some ways, the vanishing bears (signified by the rising MACD histogram troughs) are more amazing in this chart of weekly continuous gold futures than the story of the gathering bulls (signified by the size of the MACD histogram peaks). I also looked at the 1987 top by way of candlestick patterns. Throughout that year, there were multiple dark cloud cover weekly candlesticks that suggested that a significant amount of distribution was going on. Turning to 2005, are there similar sorts of patterns in the candlesticks that might warn of an impending reversal? Figure 6 — a close-up of 2005 — provides the answer.
FIGURE 6: Not only were the selloffs between late 2004 and the autumn of 2005 relatively mild, finding support at the level of the 50-week EMA, but each correction low was higher than the last.
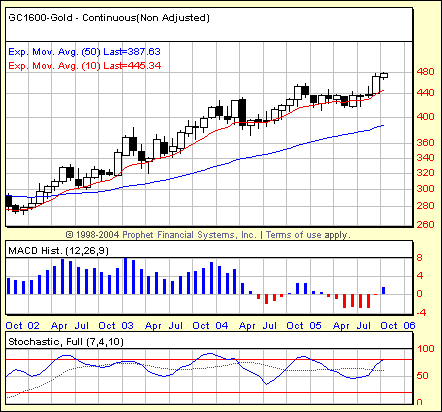
If the candlesticks in the gold market in 1987 were all about the dark cloud cover, then the candlesticks in the gold market in 2005 are clearly accentuating the positive. There are, for example, three selloffs shown in Figure 6 — one late in 2004, another in the spring of 2005, and a third in the summer of 2005. In none of these cases was the sort of dire, dark cloud cover the form of the correction. Although occasionally sharp — as was the late 2004 correction — the technical circumstances surrounding those selling episodes were unremarkable. Actually, if there is anything remarkable about those selling episodes, it was the amazing way that all three corrections found support on the 50-week exponential moving average (in blue). While there was brief penetration in the late spring/early summer period, the lows of late spring still remained above the lows of the late 2004 correction, and the lows of the summer 2005 correction remained above the lows of the late spring 2005. Higher lows = advancing market. So far, it looks like the gold market in 2005 is a lot different technically from the gold market in 1987. Finally, however, let's take a look at the monthly charts and see if the MACD histogram and stochastic provide any insights at that time frame. If there are any shades of 1987 in the gold market of 2005, then those shadows might be lurking in the monthly chart of recent gold trends (Figure 7). The strongly positive MACD histogram trends of 2002 and 2003 have, by the third and fourth quarter of 2004, turned only weakly, so where they are were not outright negative. More important, the MACD histogram trough in 2005 is deeper than the one in 2004, while the MACD histogram peak in 2005 is lower than the one in fourth-quarter 2004.
FIGURE 7: Strong MACD histograms throughout 2003 went to weaker MACD histogram peaks in the fourth quarter of 2004 and weaker still MACD histogram peaks in the early days of the fourth quarter of 2005.
Again, the point here isn't to necessarily suggest that the technical picture in 2005 is in and of itself bullish or bearish. Rather, the idea is to compare and contrast the 1987 gold market peak with the soaring gold market in 2005. If the technical features we found in abundance in 1987 were similarly prominent in 2005, then it would be difficult for a technician to maintain a bullish stance relative to gold in 2005 and beyond. However, if the technical features in the 1987 gold market are nowhere apparent in the gold market in 2005, then the possibility of continued advances in gold prices remains bright. Seen this way, the declining monthly MACD histogram is among the chief negatives arguing against higher gold prices in the near term. There are four peaks in MACD histograms since January 2003: January 2003 itself, December 2003, November 2004, and (so far) October 2005. Each of these four peaks in the MACD histogram has been lower than the one that preceded it. That is a bearish trend, reflecting a weakening on the part of the bulls even as the price of gold has climbed dramatically over the same period. So buy gold or sell gold? It is hard to make a case for a 1987-style top in the gold market at this time. The warning signs that appeared in 1987 are nowhere apparent in 2005. Of course, the gold market could correct — or even crash — without providing a plethora of clear "look out below!" signs for traders to spot. But such corrections and crashes are rare. The beauty of technical analysis is that corrections and crashes — just like bounces and new bull markets — tend to telegraph themselves in the days, weeks, or months before they happen. It reminds me of something that Rickson Gracie, one of the most legendary no-holds-barred, jiu-jitsu fighters, used to say about his art: "Jiu-jitsu is perfect. It is human beings who make errors." In other words, the clues are often there; the task remains for the dedicated technician to discover them. The fact that the clearest warning signs at present are taking place at the monthly level (that is, monthly price charts) suggests that, at a minimum, there is some tradable upside left in gold. But it would be advisable to keep a close watch on the weekly trends. Any deterioration there could be the first signs that the gold bull market — one of the true trading "success stories" of the early 21st century — is finally about to call it a day.
David Penn may be reached at DPenn@Traders.com. SUGGESTED READING Charts courtesy Prophet.net Current and past articles from Working Money, The Investors' Magazine, can be found at Working-Money.com.
|
Technical Writer for Technical Analysis of STOCKS & COMMODITIES magazine, Working-Money.com, and Traders.com Advantage.
| Title: | Traders.com Technical Writer |
| Company: | Technical Analysis, Inc. |
| Address: | 4757 California Avenue SW |
| Seattle, WA 98116 | |
| Phone # for sales: | 206 938 0570 |
| Fax: | 206 938 1307 |
| Website: | www.traders.com |
| E-mail address: | DPenn@traders.com |
Traders' Resource Links | |
| Charting the Stock Market: The Wyckoff Method -- Books | |
| Working-Money.com -- Online Trading Services | |
| Traders.com Advantage -- Online Trading Services | |
| Technical Analysis of Stocks & Commodities -- Publications and Newsletters | |
| Working Money, at Working-Money.com -- Publications and Newsletters | |
| Traders.com Advantage -- Publications and Newsletters | |
| Professional Traders Starter Kit -- Software | |
PRINT THIS ARTICLE

Request Information From Our Sponsors
- StockCharts.com, Inc.
- Candle Patterns
- Candlestick Charting Explained
- Intermarket Technical Analysis
- John Murphy on Chart Analysis
- John Murphy's Chart Pattern Recognition
- John Murphy's Market Message
- MurphyExplainsMarketAnalysis-Intermarket Analysis
- MurphyExplainsMarketAnalysis-Visual Analysis
- StockCharts.com
- Technical Analysis of the Financial Markets
- The Visual Investor
- VectorVest, Inc.
- Executive Premier Workshop
- One-Day Options Course
- OptionsPro
- Retirement Income Workshop
- Sure-Fire Trading Systems (VectorVest, Inc.)
- Trading as a Business Workshop
- VectorVest 7 EOD
- VectorVest 7 RealTime/IntraDay
- VectorVest AutoTester
- VectorVest Educational Services
- VectorVest OnLine
- VectorVest Options Analyzer
- VectorVest ProGraphics v6.0
- VectorVest ProTrader 7
- VectorVest RealTime Derby Tool
- VectorVest Simulator
- VectorVest Variator
- VectorVest Watchdog

