HOT TOPICS LIST
- Strategies
- Stocks
- Buy
- Investing
- Brokers
- Psychology
- Interviews
- Accumulate
- Sell
- Hold
- Spotlight
- Websites
- Candlestick Corner
- Gold & Metals
- Options Trading
LIST OF TOPICS
MARKET COMMENTARY
Is The Market Really In A Trading Range?
10/21/05 02:58:59 PM PSTby Michael McDonald
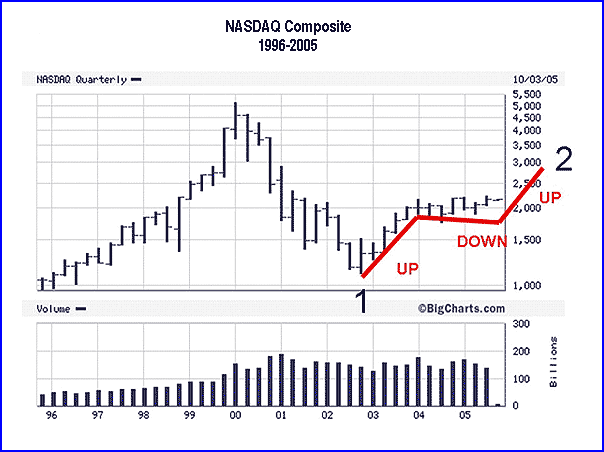
It would seem so, since the market appears to be starting a five-month rally that should complete wave 2 of a long-term horizontal correction.
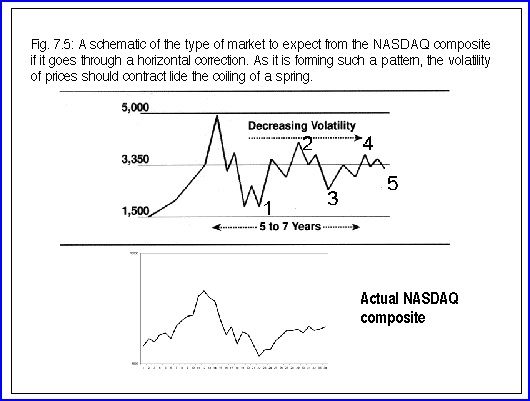
| Is the market in a trading range? The answer is "Yes." For the last five years, the NASDAQ Composite has been forming what Elliott wave theorists call a horizontal correction. This is good news to traders, since it is one of the most predictable Elliott wave patterns there is. We are still completing wave 2, which started at the bear market bottom in October 2002. Once wave 2 is complete (probably in the spring of 2006), a three-section-down wave will begin. This down wave -- wave 3 -- will be considered a bear market. During a corrective period, not all indexes experience a horizontal correction. For example, while one major index makes a horizontal correction, another goes through a normal ABC correction, and a third index actually hits new highs, finishing an advancing cycle. A horizontal correction almost always occurs during a period of divergences; in fact, the existence of divergences helps confirm the interpretation. This is happening today. While the NYSE Composite and the Russell 2000 are coming off all time highs, the Standard & Poor's 500 and the NASDAQ are far from it and seem to be forming a lower top — wave 2 — of a horizontal correction. At the same time, the Dow Jones Industrial Average (DJIA) has been in a flat trading range much like the 1970s. This is a confirming sign that we are still in a larger-scale correction that began in the year 2000. A TRADING RANGE FORECAST WHERE DO WE STAND? The other view is that the bear market did not fully correct the secular bull market and we are still in the correction. This second view is founded on the well-established Elliott wave principle that corrections are usually composed of two or more declining sections. This principle should be especially true if the preceding bull market was 18 years long. This was the view taken in 2000, and what I still believe today. It may be helpful to show the 2001 schematic used to diagram the expected correction. Look at Figure 1. The top graph is the original schematic out of the book. I used the NASDAQ Composite, since I thought it would make the clearest pattern compared to other indexes. The correction was to last up to seven years. For comparison, the graph beneath it is the actual NASDAQ plotted since 1998.
Figure 1: WHAT CAN YOU EXPECT? Here's what you can expect from the NASDAQ Composite if the market goes through a horizontal correction. IS NASDAQ IN A CORRECTION? The original price targets were a little off. It called for a bottom at 1700, and the real bottom occurred at around 1100. In my opinion, the critical point in the argument should not be the specific price levels, but the geometric pattern. The price pattern of a horizontal correction is clearly defined. There are five movements in the overall correction and each of these movements, both up or down, break down into three smaller movements or waves. When prices move from a bottom to a top, they make an up-down-up pattern. When they move from a top to a bottom, they do so in a down-up-down pattern. You see this in Figure 1. It was postulated that this trading range would be different than the 1970s range. That range had a flat top at Dow 1000. In this correction, the top would decline over time (at least in the NASDAQ). In other words, the composite would never approach the previous top at 5000 during the entire seven-year correction. It was also suggested that the correction would show a decrease in volatility as it progressed. This expectation has materialized, at least in the NASDAQ, as the market is experiencing much lower volatility than it has. If this continues, the price pattern should eventually coil up like a spring, as if the index had been put in a straitjacket. ARE WE IN WAVE 2?
Figure 2: A POSSIBLE WAVE 2
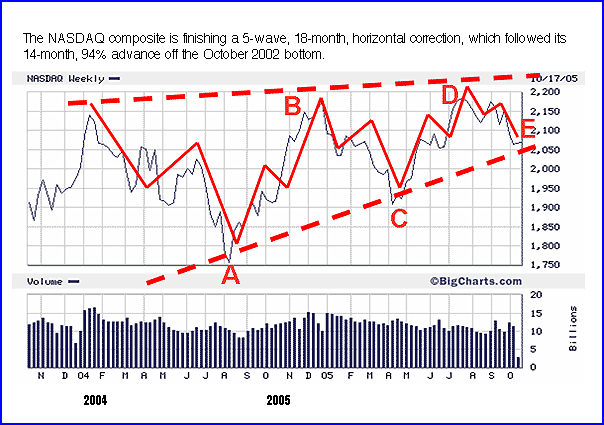
The flat price pattern since January 2004 — now a year and a half old — is essentially the down section. This down section formed a five-wave horizontal correction of its own, as can be seen in Figure 3. This correction now appears complete. If this is true, the third movement of wave 2 (the second "up" movement) is just beginning.
Figure 3:A FIVE-WAVE HORIZONTAL CORRECTION
R.N. Elliott gave a guideline to project the extent of an advancing wave after the completion of a horizontal correction. He said that the advance, measured from the breakout point at the top of the triangle, would travel a distance equal to the widest part of the correction. The widest part of the triangle is about 500 NASDAQ Composite points. Adding this to the breakout level at about 2250 gives a minimum price target of 2750. I think this would occur by mid-spring and, if it happens, the entire advance since October 2002 will then show three complete waves. CONFIRMATION FROM INVESTOR SENTIMENT Does this mean we are at an extreme low in the market? That brings up an interesting point on contrary opinion. It is normal when bearish sentiment rises as prices decline; we expect a put to call ratio of 1.07 at the bottom after a two-year decline. The reality of the big price finally hits home, creating the massive bearish sentiment we find at a bear market bottom. However, there are times when you get extreme bearish sentiment, even when prices haven't declined much (like it is now, according to some indicators). These are always important points in the market. It reflects a fear of what investors think is about to happen more than a trend-following reaction to what has already occurred. It is interesting today that we have extreme readings in sentiment after a decline of only 5%. This indicates a strong stock market and gives credence to the idea that this is not the start of a major decline but the end of a correction prior to another major advance. Here's a rule: When you get indicators of investor sentiment displaying extreme bear market readings yet prices are not far from their highs, watch out: That little correction is probably a high-level consolidation prior to another advance. OTHER CONCLUSIONS The second statement is that after the completion of wave 2, wave 3 follows. Wave 3 is a declining wave; it should be big enough for many to consider it another bear market. It should not, however, be anything like the massive wave 1 decline, because a horizontal triangle almost always has contracted movements. The later movements are almost always smaller than the early ones (see Figure 1). Another point is that the time scale of the correction must be extended — again. Once wave 2 finishes, there are still waves (3), (4), and (5). Granted, they should be shorter in time and price than the first two waves, but it is unrealistic to believe they will finish in two more years. Four or five is more realistic, estimating completion around 2010. AN ECONOMIC "WHY" For example, the economic reason originally offered in 2000 for a lengthy sideways correction was simple: the market had gotten too far ahead of itself and needed to catch up. With P/E ratios of 100 for the NASDAQ and 35 for the S&P 500, this was obvious. However, after five years, the excesses are almost gone. If this correction is to last another five years, what economic reason could be behind it? There is no doubt the economy has recovered, but after five years, the earnings of the S&P 500 are only 16% higher than they were in 2000. Look what it took to get there — four years of the largest economic stimulation effort in US history. It has taken record low interest rates, record federal spending plus two tax rebates, plus US consumers spending $700 billion more a year than they are producing (resulting in a trade deficit) to make this happen. The US savings rate is finally at zero or even negative. There is absolutely nothing left to give. I get the image of a bedridden patient barely able to move, who, after being given heavy dosages of growth hormones, testosterone, and adrenaline, jumps out of bed and does a hundred pushups. People marvel, saying how strong he is. But watch what happens once the chemicals wear off. TOUGH TIMES FOR BUY & HOLD This belief came out of the unique features of the 2000 bear market. That bear market was strange in that it was more a massive rebalancing between growth and value than a true bear market. I think this is going to change. During the remainder of this horizontal correction, trading methods that go 100% into cash (or go short) will again emerge as the best strategy to protect assets and make gains. I don't believe the current strategy of constantly chasing the strongest groups will work in the coming market. MARKET TIMING WILL AGAIN BE KING If this rally materializes (if the NASDAQ Composite carries up to 2800 by spring), it should help confirm the original projection made in 2001 of a horizontal correction. We'll revisit this story then.
Michael McDonald (mjm@gmanalyticcom) is a former senior vice president of investments at a national brokerage firm, where he managed more than $500 million in retirement assets. A native of Los Angeles, CA, he has given more than 700 retirement and investment seminars over the past 15 years. He has been a market technician for more than 35 years and has written two books on the subject. In the late 1980s he was a weekly market commentator for KWHY Channel 22 in Los Angeles for three years. Currently, he is currently writing a book on globalization. SUGGESTED READING
Current and past articles from Working Money, The Investors' Magazine, can be found at Working-Money.com.
|
PRINT THIS ARTICLE

Request Information From Our Sponsors
- StockCharts.com, Inc.
- Candle Patterns
- Candlestick Charting Explained
- Intermarket Technical Analysis
- John Murphy on Chart Analysis
- John Murphy's Chart Pattern Recognition
- John Murphy's Market Message
- MurphyExplainsMarketAnalysis-Intermarket Analysis
- MurphyExplainsMarketAnalysis-Visual Analysis
- StockCharts.com
- Technical Analysis of the Financial Markets
- The Visual Investor
- VectorVest, Inc.
- Executive Premier Workshop
- One-Day Options Course
- OptionsPro
- Retirement Income Workshop
- Sure-Fire Trading Systems (VectorVest, Inc.)
- Trading as a Business Workshop
- VectorVest 7 EOD
- VectorVest 7 RealTime/IntraDay
- VectorVest AutoTester
- VectorVest Educational Services
- VectorVest OnLine
- VectorVest Options Analyzer
- VectorVest ProGraphics v6.0
- VectorVest ProTrader 7
- VectorVest RealTime Derby Tool
- VectorVest Simulator
- VectorVest Variator
- VectorVest Watchdog


