

HOT TOPICS LIST
- Strategies
- Stocks
- Buy
- Investing
- Brokers
- Psychology
- Interviews
- Accumulate
- Sell
- Hold
- Spotlight
- Websites
- Candlestick Corner
- Gold & Metals
- Options Trading
LIST OF TOPICS
TRADER'S NOTEBOOK
Into The Money Flow: Sorting Out The Volume Indicators
11/10/05 02:53:37 PM PSTby Sharon Yamanaka
Which is the best money flow indicator? Here's some comparison on the subject.
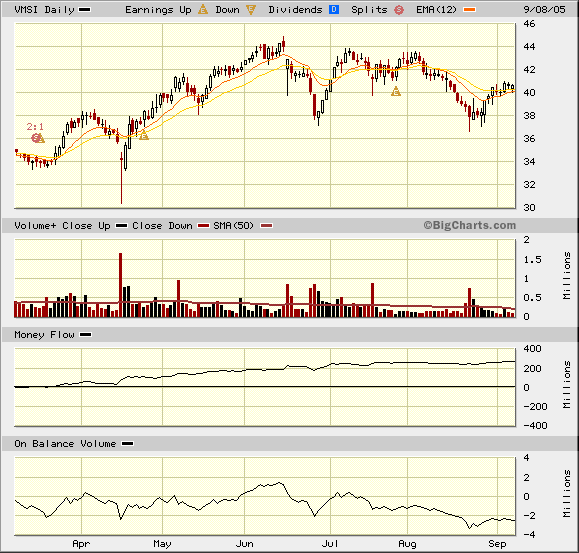
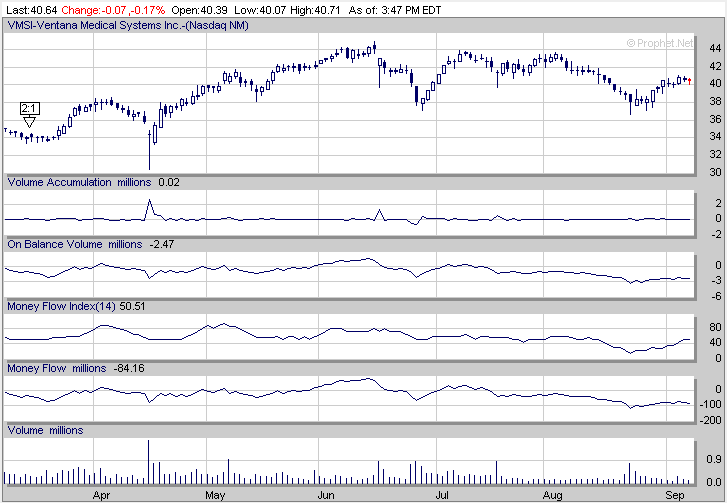
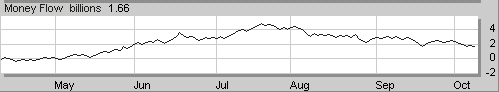
| As a technically based trader, I find volume to be one of the most useful tools possible with which to analyze a stock chart. Volume gives credence to price movement and divergence gives warning. It also tends to lead price. So what happens when one of the most basic volume indicators, money flow the default on at least one charting website comes out with different, if not to say opposite, readings? Money flow is defined with a specific formula. First, an average price: (high + low + close) / 3) is calculated, then multiplied by the volume. If the average price is lower than the closing price, money flow is positive. If the average price is higher than the closing price, then money flow is negative. From there, a running total is kept to show buying and selling pressure. Granted, money flow is a rather crude way to assign volume, but should it be positive, flowing upward at one website (Figure 1), and in negative territory, going south at another (Figure 2)? If this were a high school algebra class, someone would be getting an "F."
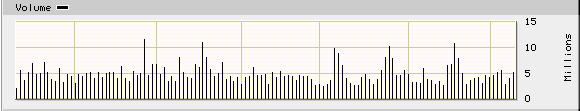
Figure 1: BigCharts.com. Money flow, third from the top, for VMSI is flowing in at almost 300 million.
Figure 2: PROPHET.NET. Here are volume Indicators on Prophet.net's technical charting website.
However, I am willing to give the programmers the benefit of a doubt and say that if they changed the original formula, it would be because they'd found something better. But if they did, I would need to know about it so I can apply it correctly. Smoothed? Or a 21-day cumulative total? It would make a difference in the chart. Let me use Ventana Medical Securities (VMSI) as an example. BigCharts shows a positive money flow, almost 300 million, whereas Prophet.net shows VMSI's volume almost 100 million in the negative. This gave me two completely different pictures on the strength of this particular stock. Both websites had similar definitions of money flow but were obviously using a different method for their running total. From there I went to MetaStock, which didn't include money flow. The closest indicator was the money flow index, so I created the formula for money flow and got a completely different third version. At this point, I decided to review all the volume indicators and find the most accurate. That turned out to be easier said than done. Here's a synopsis of what appeared to be the most commonly found volume indicators, going from the simplest to the most complex.
JUST THE VOLUME
The SEC dictates how volume is counted. Thus, volume is counted in the same manner on all markets based on the above reporting structure. Any time money changes hands (or any time capital is risked), it must be counted as a trade. For the most part a trade is a trade, except in the following instance:
A Market Maker receives an order to buy 100 shares from its client. It does not have 100 shares in its inventory. It must go buy 100 shares from someone else. It then sells these 100 shares to the client. Thus, there are two trades in this example for a total of 200 shares.
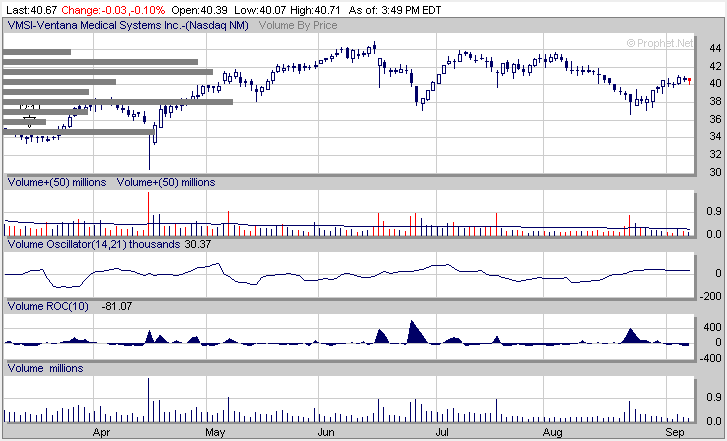
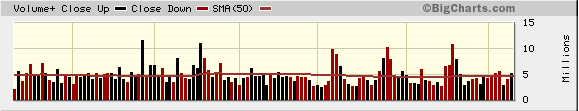
Volume+: Adds color to the volume bars. The beginning of money flow, up days are differentiated from down days by color. Up days, for example, are black and down days are red. By visually assessing the amount of red or black, whether there are more high-volume red or black bars, you can get a rough idea of buying and selling pressure. Volume by price: Assigns the volume to the price and charts it in horizontal bars on the price chart's y-axis. If you were unsure of your support/resistance areas, the big, long volume bars scream them out and suggest their importance. The percentage volume oscillator (PVO) plots two moving averages, typically 12- and 26-day, of volume and creates a histogram of the percentage difference between two moving averages. The indicator is calculated using the following formula:
Volume Oscillator (%) - PVO = ((Vol 12-day EMA - Vol 26-day EMA)/Vol 12-day EMA) x 100
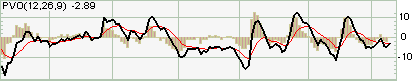
If this sounds familiar, it's because PVO does to volume what the moving average convergence/divergence (MACD) does to price. Like the MACD, both the moving averages and histogram can be plotted (Figure 3).
Figure 3: STOCKCHARTS.COM. The StockCharts.com example of PVO, along with everything else they have to offer: Volume+, price by volume, and accumulation/distribution, with zigzag has been thrown in to show the highs and lows.
An oscillator such as PVO creates a ratio, in this case between fast and slow exponential moving averages (EMA), and plots it as a histogram around a zero line. Looking at the formula, you can see that the faster moving average is divided by the slower. So when the faster average is higher, the histogram is positive because the volume is increasing; when the faster average is below the slower, volume is decreasing and the histogram is below the zero line. The moving averages themselves are also plotted. Oscillators like the PVO alert traders to market extremes in the following conditions:
Any of these signals indicate momentum changes for volume, and volume precedes price. One drawback is that during trending markets, an oscillator tends to stay in extreme territory (above 80 or below -80) and is less useful. That's why oscillators are more useful during consolidation periods. The PVO, though, is in no way linked to the price its warning of an extreme in volume doesn't mean the same thing as an extreme in price. High volume usually confirms the price movement. If the price is moving up on high volume, then it's confirming the movement up. If there's a sudden reversal on high volume, then that confirms the reversal. Figure 3 shows PVO for VMSI. Currently, as the stock price has been dropping, the volume has been picking up, so there is a divergence. PVO is just around the zero, or neutral mark, while price has dropped slightly below support at 37.5. Would you buy in? A turnaround would have to be on convincing volume, which hasn't happened yet.
INDICATORS COMBINING VOLUME WITH PRICE
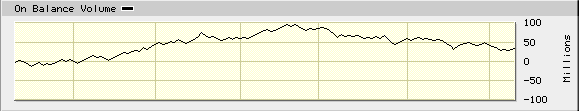
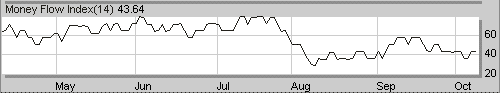
If the closing price is below the previous day's close, it is subtracted. The OBV does not change, no matter what the volume, if the closing price remains constant. Chaikin indicators: Marc Chaikin, a stockbroker and analyst since 1966, further developed volume indicators. Much of his work was devoted to determining whether stocks were under accumulation or distribution and then applying momentum indicators for timing. The Chaikin money flow index, accumulation/distribution line, and the Chaikin oscillator were all refinements of currently used indicators, each building upon the former. Money flow: A modification of OBV, money flow uses an average price rather than a closing price for its calculations and multiplies the average by the volume. Interestingly, Marc Chaikin changed from the opening to an average price when the opening price for stocks was taken out of the daily newspaper and trader Larry Williams' formula became harder to compute. Money flow can be used independently and charted as a cumulative total, or the raw figure can be used as part of the money flow index equation. Money flow index: The money flow index (MFI) takes money flow's raw data and turns it into an oscillator by separating out the positive money flow from the negative money flow and dividing the former by the latter. This gives a ratio, which is then inverted and multiplied by 100 to create an oscillator, which, in this case ranges from a scale of zero to 100. The advantage of an oscillator is that it gives buy and sell signals.
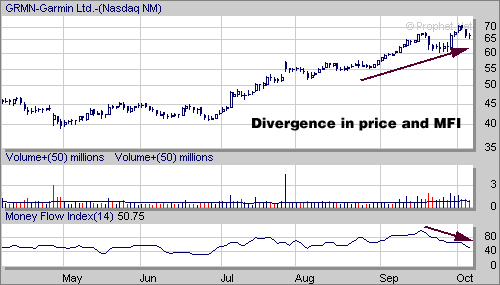
As with other oscillators, divergences signal reversals, and readings under 20 or over 80 signal oversold/overbought conditions (Figure 4).
Figure 4: GARMIN, MONEY FLOW INDEX. Garmin (GRMN) with volume and money flow index. The stock is going up, but the money flow index shows a slowing of buying volume, which could signal a slowing of the very impressive upward trend.
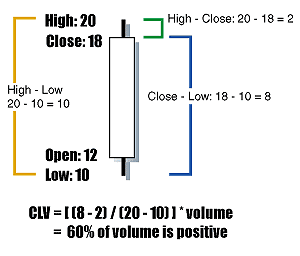
Volume accumulation: Chaikin's volume accumulation/distribution (A/D) line attempts to fine-tune traditional volume indicators like the OBV. Instead of assigning all the period's volume to either buyers or sellers, the A/D assigns a proportional amount of volume based on the relationship between the closing price and intraperiod mean price. When plotted, the A/D line is the cumulative total of the close location value:
CLV = [(Close-low) (High Close) / (High Low)] * Volume
The (close-low) (high-close) gives the intraperiod mean price, and (high low) is the total price range for the day. The ratio would give you a number between -1 and 1, which is then multiplied by the volume. If prices close at the period's high or low, all volume for that period will be assigned accordingly, regardless of the relationship to the intraperiod mean price. A cumulative total of the results is then plotted (Figure 5).
Figure 5: CLV. An example of CLV calculations showing the relationships between the intraperiod mean price and the price range. So the closer the close is to the high, the larger the amount of volume is added to the cumulative total and vice versa.
Chaikin's 21-day money flow indicator: Chaikin's money flow indicator creates a 21-day moving average of the A/D line, which it then turns into a ratio. By using a moving average, data is smoothed and everyday jitters are removed to clarify the direction or existence of the underlying trend. As a moving average, the MFI is a trend-following indicator that lags behind the trend. Moving averages are calculated by taking the total sum in a given period, then dividing by the period. In this case, it is 21 days.
(A/D Day 1 + A/D Day 2 + ... +A/D Day 21) / 21 = 21-day MA of A/D line
Marc Chaikin then turned the moving average into a ratio by dividing the moving average by the total volume for the past 21 days:
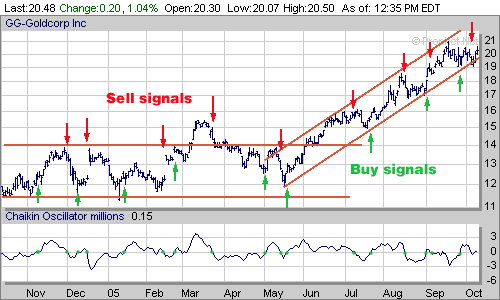
By using a ratio, buy and sell signals are given. Readings above 10 are considered bullish and above 25 extremely bullish. Conversely, -10 is bearish and -25 extremely bearish. Chaikin's oscillator:Similar to the PVO, the Chaikin oscillator uses a fast and slow moving average, but instead of using an EMA of the volume, it generates an EMA of the A/D line, and therefore incorporates price. The oscillator predicts changes in the A/D line, and is intended to lead the line. As a leading indicator, it predicts changes in the momentum of the volume, which in turn precedes changes in the direction of price. Also keep in mind that it is an oscillator of an oscillator, and is better used in conjunction with other momentum indicators such as the relative strength index (RSI) or the commodity channel index (CCI). See Figure 6.
Figure 6: GOLDCORP. Prophet.net showing Goldcorp (GG) with the Chaikin oscillator. Trendlines and buy sell signals have been given by centerline crossovers. The signals were more tradable when GG was trading between 11.5 and 14.
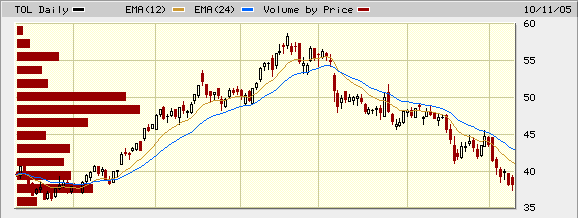
This indicator is created by subtracting the 10-period EMA from the three-period EMA of the A/D line. This is another one of the indicators that had differing formulas and charts on different websites. Some sites used an EMA, one used a SMA, and others charted the difference, while others said they charted the cumulative sum of the differences. In order for it to act as an oscillator like the MACD, the difference of the two moving averages would simply be charted, and this would allow the line to cross zero whenever the slow and fast lines crossed. Note even the slow 10-day EMA is much faster than the 21-day MA used in Chaikin's money flow indicator. This quicker indicator is intended to lead the A/D line, which lags. It also tends to work better when the stock is in a trading range. StockCharts.com suggests that it be used in conjunction with A/D line itself. When there is a divergence between the oscillator and A/D line, and the oscillator predicts the A/D line, a change in the stock movement would be indicated. The sidebar "Summary of the volume indicators" shows a side-by-side comparison of the volume indicators. Using Toll Brothers (TOL) as an example as it goes through an upward trend reversal, you can see the changes in volume and compare the responses of the volume indicators.
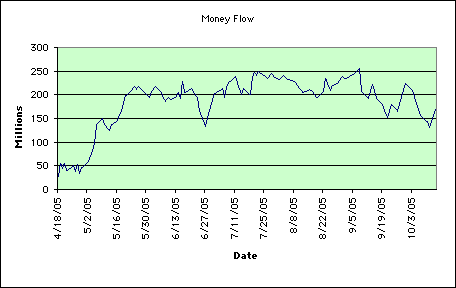
CONCLUSION Finally, I constructed my own money flow chart for VMSI in Excel (Figure 7). It showed me that money is indeed still positive, despite the stock's downward trend. In my version, the line is quite choppy and I can understand the impulse to smooth it out.
Figure 7: VMSI. VMSI charted in Excel using the original money flow formula. Another unique version of money flow.
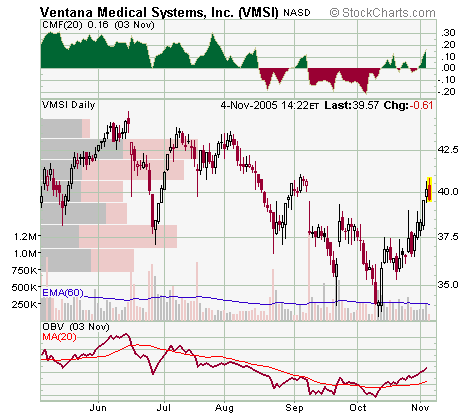
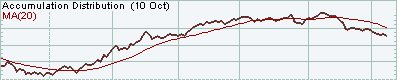
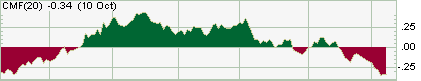
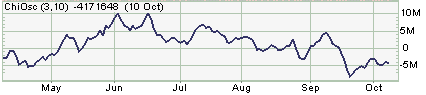
Now, at the beginning of November, VMSI is hovering around the $40 mark. Going back to StockCharts.com (Figure 8), since I originally started looking at this stock in mid-September, VMSI has formed a double bottom, then begun an upward trend. CMF and OBV are rising, along with the stock's price.
Figure 8: VMSI's chart as of November 4, 2005, using volume+, volume by price, Chaikin's money flow and OBV.
Using the double bottom to calculate a target for the upward trend, I take the dip between the double bottom ($38) and subtract the low from the bottoms ($34) to get $4. Then I add this to the dip and get a target of $38 + $4 = $42. There's a large volume price bar at 42.5 to reinforce this target and the volume has been declining through the uptrend, so I'd sell at $42. There's another big resistance area at $37, so my stop would be slightly below. Or, if I have a specific amount of money that I didn't want to risk for the $2 gain, I'd put the stop right at $37, or perhaps rethink the whole trade. As they say, timing is everything.
Sharon Yamanaka can be reached at SYamanaka@Traders.com. RELATED READING ‡BigCharts.com ‡Prophet.net ‡StockCharts.com Current and past articles from Working Money, The Investors' Magazine, can be found at Working-Money.com. SIDEBAR:
VOLUME Volume
Volume+
Volume By Price
Percentage Volume Oscillator ([(Vol. 12-day EMA) (Vol. 26-day EMA)] / Vol. 12-day EMA) * 100
VOLUME COMBINED WITH PRICE On-Balance Volume (OBV)
Money Flow MF = ([High + Low + Close] / 3) * Volume
Money Flow Index (MFI) 100 (100/[1 + (positive money flow / negative money flow)])
CHAIKIN INDICATORS Volume Accumulaton/Distribution (A/D) CLV = [(Close Low) (High Close) / (High Low)] * Volume
*(Close-Low) - (High-Close) = intra-period mean price
Assigns a proportional, rather than total, amount of volume as positive or negative money flow.
Chaikin's 21-Day Money Flow Chaikin's MFI = ([Sum 21-day (CLV) (Vol.)] / 21-day total volume)
Chaikin's Oscillator Chaikin Oscillator = CLV 3-day exponential moving average CLV 10-day exponential moving average.
|
| Title: | Staff Writer |
| Company: | Technical Analysis, Inc. |
| Address: | 4757 California AVE SW |
| Seattle, WA 98116 | |
| Phone # for sales: | 206 938 0570 |
| Fax: | 206 938 1307 |
| Website: | www.Working-Money.com |
| E-mail address: | syamanaka@traders.com |
Traders' Resource Links | |
| Charting the Stock Market: The Wyckoff Method -- Books | |
| Working-Money.com -- Online Trading Services | |
| Traders.com Advantage -- Online Trading Services | |
| Technical Analysis of Stocks & Commodities -- Publications and Newsletters | |
| Working Money, at Working-Money.com -- Publications and Newsletters | |
| Traders.com Advantage -- Publications and Newsletters | |
| Professional Traders Starter Kit -- Software | |
PRINT THIS ARTICLE

Request Information From Our Sponsors
- StockCharts.com, Inc.
- Candle Patterns
- Candlestick Charting Explained
- Intermarket Technical Analysis
- John Murphy on Chart Analysis
- John Murphy's Chart Pattern Recognition
- John Murphy's Market Message
- MurphyExplainsMarketAnalysis-Intermarket Analysis
- MurphyExplainsMarketAnalysis-Visual Analysis
- StockCharts.com
- Technical Analysis of the Financial Markets
- The Visual Investor
- VectorVest, Inc.
- Executive Premier Workshop
- One-Day Options Course
- OptionsPro
- Retirement Income Workshop
- Sure-Fire Trading Systems (VectorVest, Inc.)
- Trading as a Business Workshop
- VectorVest 7 EOD
- VectorVest 7 RealTime/IntraDay
- VectorVest AutoTester
- VectorVest Educational Services
- VectorVest OnLine
- VectorVest Options Analyzer
- VectorVest ProGraphics v6.0
- VectorVest ProTrader 7
- VectorVest RealTime Derby Tool
- VectorVest Simulator
- VectorVest Variator
- VectorVest Watchdog