HOT TOPICS LIST
- Strategies
- Stocks
- Buy
- Investing
- Brokers
- Psychology
- Interviews
- Accumulate
- Sell
- Hold
- Spotlight
- Websites
- Candlestick Corner
- Gold & Metals
- Options Trading
LIST OF TOPICS
TRADER'S NOTEBOOK
Correlation Analysis
12/21/05 01:21:05 PM PSTby Sebastien Michea and Philippe Buriot
Extend technical and fundamental analyses with correlation analysis to forecast market behavior.
| It is in everyone's best interest to be able to forecast the financial markets. In this article, we present a correlation analysis that is an extension of both technical and fundamental analyses. After a brief review of technical and fundamental analyses from a forecasting point of view, we introduce correlation analysis, an extension of both, and show how it can be applied. Finally, we present an indicator that implements those new methods, and gives some perspectives offered by correlation analysis. TECHNICAL ANALYSIS Even if not always stated, the goal of technical analysis is to provide forecasts. Consider the following simple strategy associated with Bollinger Bands:
·Buy if the price crosses above the upper bands We can easily explain this particular strategy in terms of forecasts. Buy events are produced when a rise in prices is predicted and sell events are produced when a fall is anticipated. In the former, the forecast is simply given by the moving average. Since price crosses the lower band when it is relatively lower than the moving average, therefore lower than the predicted value, a sell event is triggered. Similarly, when price crosses the upper band, which is relatively higher than the moving average and higher than the predicted value, a buy event is triggered. The degree of freedom in technical analysis lies in the variation of the parameters of the indicators. You can, for example, use Bollinger Bands or detect a pattern using Elliott wave theory to envision the price trends in an oil company's stock, in an index like NASDAQ, or even in the dollar/euro exchange rate. FUNDAMENTAL ANALYSIS For fundamental analysts, this intrinsic value represents a predicted price of the stock: For instance, if the actual price of the stock is less than its intrinsic value, it is time to buy. Even if the formula used to determine the intrinsic value of the stock is not given, it relies on some refined form of the input data. This refinement uses indicators instead of raw data, and the goal is to highlight specific aspects of the company. Ratios like earnings per share, collection ratio, debt/asset ratio, or acid test are indicators that give information about the performance, activity, financing, and liquidity aspects of the company. Like technical analysis, these indicators can be applied to any company. The art of fundamental analysis is in using experience and nonquantitative information to balance the importance of the ratios and determine the intrinsic value of a stock. CORRELATION ANALYSIS When compared to technical indicators, this loss of generality and the larger amount of computation needed to find them is the price that must be paid when using correlation analysis. In order to understand the concept and benefits of correlation analysis, we'll first give you an example not related to the stock market.
Airport
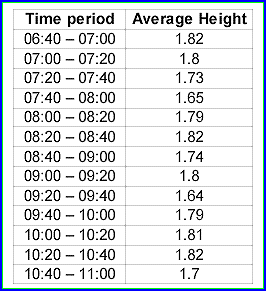
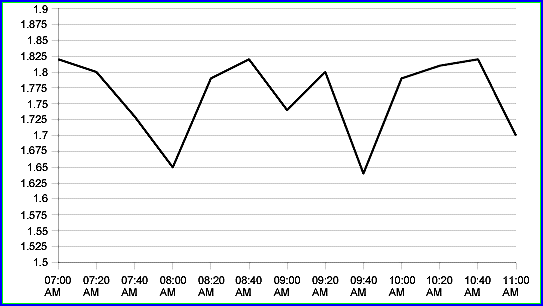
FIGURE 1: AVERAGE HEIGHT. Here you see the average height of people within specific time intervals. As you see in Figure 2, we can draw the height with respect to the time (function h(t)) and apply to it the moving average strategy. We see that the curve is below its average at 11:00, so we conclude that the average height of international passengers at that gate will go up to around 1.75 at 11:20 am.
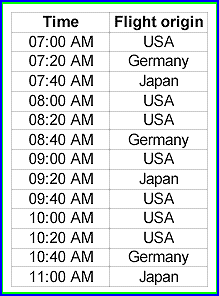
FIGURE 2: HEIGHT VS. TIME. By plotting the results on a graph, you have some idea as to where the average falls. The idea of correlation analysis is to forecast heights using not only the historical variations of height but also the variations of "related" external variables. Although it may not seem directly related to the height measures, one such external variable could be the origin of flights (Figure 3). So we introduce a new variable o(t) by assigning arbitrary numerical values to the origin of the flights: for instance, Japan=1.65, Germany=1.75, USA=1.8.
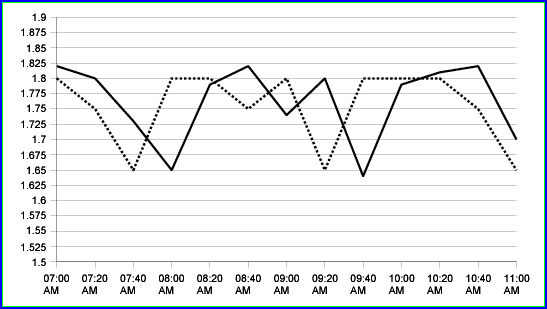
FIGURE 3: FLIGHT ORIGIN. Does height have any relation to where the flight is coming in from? Perhaps. If the algorithm used to find CorrelIndicators is based on nonlinear correlations like the one described in the next section, we can show that the results won't depend on the numerical values we assign to a flight's origin, provided that they are all different (that is, we could choose Japan=1, Germany=2, USA=3 as well). Figure 4 shows the same graph as Figure 2, now with the time series h(t) and o(t). You can see that the solid height's curve is similar to the dashed flight's origin curve, but shifted to the left by 20 minutes.
FIGURE 4: ADAPTED TIME SERIES. This is the same graph as Figure 2, but now with the time series h(t) and o(t). You can see that the solid height's curve is similar to the dashed flight's origin curve, but shifted to the left by 20 minutes. This leads us to suspect there is a correlation between o(t) and h(t):
h(t+20min)=o(t)
This formula corresponds to a CorrelIndicator whose primary variable is the height function h(t) and related variable is the flight's origin function o(t). Using this indicator, you can forecast h(11:20), or the height average between 11:00 and 11:20:
h(11:20)=o(11:00)=1.65
We see that the height forecast will fall at around 1.65 meters between 11:00 and 11:20, since 1.65 m is the average height of the Japanese people, and the flight that arrived at 11:00 came in from Japan. Therein lies the power of correlation analysis: To detect nontrivial relations between variables. APPLYING IT TO FORECASTING Unfortunately, since future values of the market are unknown, this is not very useful to forecast the price of the stock. In nonlinear correlation analysis, you would not compute the beta, but the correlation coefficients between c(t+1)/c(t) and i(t)/i(t-1), then c(t+2)/c(t) and i(t)/i(t-1), and so forth. If you obtain that one of these coefficients is close to one let's say that it is the case between c(t+2)/c(t) and i(t)/i(t-1) that means a relation like c(t+2)/c(t) = 0.9*i(t)/i(t-1) exists between the function c(t) and i(t). Note that the 0.9 coefficient has been arbitrarily chosen, but is in principle computed to minimize the difference between the left- and right-hand sides of the equation. By multiplying both sides of the equation by the quantity c(t), you obtain the CorrelIndicator:
c(t+2) = 0.9*c(t)*i(t)/i(t-1)
By knowing the present and past values of the closing price and index, this indicator computes the two-day forecast of the closing price. GENERAL CORRELATION METHOD
c(t+20)=0.8*c(t)+0.2*i(t-20)*c(t-20)-0.1*(i(t)+c(t))/(i(t+2))+...
These indicators are nonlinear, involving products and quotients and long computations, but this is unavoidable if you want the model to catch the complexity of the process that leads to the evolution of the stock price. To summarize, the steps involved in correlation analysis are:
·Choose the primary security to forecast
The two main difficulties lie in the choice of related securities and computations of the CorrelIndicators' formula. The choice of a related security cannot be easily or entirely automated, but if you know the main variables most investors consider when trading the primary security, then you will have good candidates for related securities. This is the best choice. As for computation of the indicator's formula, we cannot easily restrict the set of possible formulas to a small category like linear functions without breaking the ability to discover nontrivial correlations between the primary and the related securities. The power of correlation analysis is to discover hidden relations between variables, and this implies heavy computations. PERSPECTIVES
Sebastien Michea, PhD and Phillipe Buriot, MD are the founders of correltrade.com.
Current and past articles from Working Money, The Investors' Magazine, can be found at Working-Money.com.
|
| Website: | www.correltrade.com |
PRINT THIS ARTICLE

Request Information From Our Sponsors
- StockCharts.com, Inc.
- Candle Patterns
- Candlestick Charting Explained
- Intermarket Technical Analysis
- John Murphy on Chart Analysis
- John Murphy's Chart Pattern Recognition
- John Murphy's Market Message
- MurphyExplainsMarketAnalysis-Intermarket Analysis
- MurphyExplainsMarketAnalysis-Visual Analysis
- StockCharts.com
- Technical Analysis of the Financial Markets
- The Visual Investor
- VectorVest, Inc.
- Executive Premier Workshop
- One-Day Options Course
- OptionsPro
- Retirement Income Workshop
- Sure-Fire Trading Systems (VectorVest, Inc.)
- Trading as a Business Workshop
- VectorVest 7 EOD
- VectorVest 7 RealTime/IntraDay
- VectorVest AutoTester
- VectorVest Educational Services
- VectorVest OnLine
- VectorVest Options Analyzer
- VectorVest ProGraphics v6.0
- VectorVest ProTrader 7
- VectorVest RealTime Derby Tool
- VectorVest Simulator
- VectorVest Variator
- VectorVest Watchdog


