HOT TOPICS LIST
- Strategies
- Stocks
- Buy
- Investing
- Brokers
- Psychology
- Interviews
- Accumulate
- Sell
- Hold
- Spotlight
- Websites
- Candlestick Corner
- Gold & Metals
- Options Trading
LIST OF TOPICS
VIEWS FROM THE FIELD
"V" Is For Volume
12/28/05 03:57:20 PM PSTby David Penn
We had a conversation with Vlad Korzinin, CEO of Highland Investments, MarketVolume.com, and the mind behind modulated volume.
This is your last chance. After this, there is no going back. You take the blue pill and the story ends. You wake up at your trading desk and volume bars are whatever you want them to be. You take the red pill and you stay at MarketVolume.com and I show you how deep volume analysis goes.
With apologies to the Wachowski brothers, the "Enter the Matrix" feeling I got as Vlad Korzinin of MarketVolume.com unveiled chart after chart of price moves illuminated by his freshly patented approach to volume analysis called "modulated volume" was no joking matter. Back and forth, Korzinin would switch us from normal price charts with traditional volume bars to normal price charts with modulated volume bars. Intraday, daily, or weekly... indexes, averages, or index futures... it didn't matter. An entire world came alive in the modulated charts that just wasn't apparent on the charts with normal volume bars. Think of the moment when in the feature film The Wizard of Oz goes from black & white to Technicolor, of the moment when Al Jolson in The Jazz Singer utters the first words ever spoken in a movie (the words? "Wait a minute, wait a minute. You ain't heard nothing yet!"). Sure, it may be a bit of a reach to compare Korzinin's work on modulated volume with two of the signature moments in the history of motion pictures. But there is no denying that Korzinin and MarketVolume are intent on changing the way investors and speculators, traders, and technical analysts look at, understand, and trade volume. And given the fact that volume analysis is perhaps one of the most underresearched aspects of technical trading, rest assured that Korzinin is convinced that change will be for the better. With a barely suppressed laugh, Vlad Korzinin admits that he had been somewhat hesitant to discuss his concept of modulated volume until his company had managed to secure a patent on the process. Always proprietary and now safely patent-pending, modulated volume is ready for its coming-out party — and the markets couldn't be more ready. THAT OLDE TYME VOLUME A few decades later, Robert Edwards and John Magee published their seminal book, Technical Analysis Of Stock Trends. In this effort to systemize many of the most successful insights into trading in general and technical trading in specific, Edwards and Magee introduced the concept of volume as one that is widely acknowledged but poorly understood:
"Volume Goes with the Trend" — those words, which you may often hear spoken with ritual solemnity but little understanding, are the colloquial expression for the general truth that trading activity tends to expand as prices move in the direction of the prevailing Primary trend.
And then continue to state what might be called the "unified theory" of volume analysis that has persisted ever since:
Thus, in a bull market, volume increases when prices rise and dwindles as prices decline; in bear markets, turnover increases when prices drop and dries up as they recover... but to this rule again there are exceptions, and useful conclusions can seldom be drawn from the volume manifestations of a few days, much less a single trading session; it is only over the over-all and relative volume trend over a period of time that may produce helpful indications.
Of this rule, there has been little debate in the 60-plus years since Edwards and Magee first wrote about their insights into the relationship between volume and trends. Indeed, affirmations of this rule can be found in almost all subsequent work that even briefly references volume analysis: from John Murphy and Martin Pring to Stan Weinstein and William O'Neil. It could be argued that much (though not all) of the research in volume analysis since has been less geared toward disproving Edwards and Magee's summations as to finding different ways of quantifying those observations. Thus, we have Joseph Granville's on-balance volume indicator in 1963, followed by a host of other volume-based indicators. Some of these indicators looked strictly at volume — such as Herrick payoff index, volume oscillator, and volume rate of change (ROC).
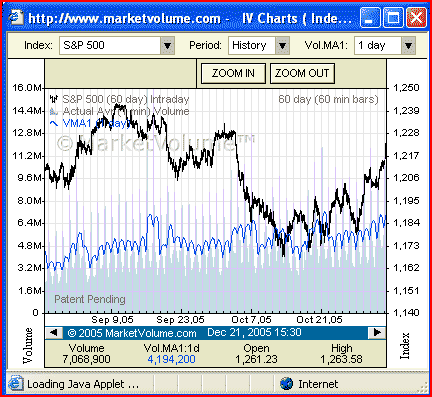
Figure 1: S&P 500, Daily. Average volume on index charts often tells investors and traders little about where true strength and true weakness lies.
But many others combined price and volume data in an effort to further interpret future price action. These indicators — from the money flow index and ease of movement to positive and negative volume indexes and any number of accumulation/distribution-oriented indicators — marked the next evolution in volume analysis, adding price and occasionally time clues to the volume equation. Along with even more esoteric analysis such as Steve Woods' work with float analysis, this price/time/volume research stood as some of the most incisive work on understanding what role volume can play in helping traders anticipate the likelihood of future price action. Some practical problems remained, however, chiefly among them the problem of trend reversals. Clearly, volume is an excellent tool for trend-following — but can it be used to help mark turning points in a trend, those places where, as Victor Sperandeo put it, trends change and "fortunes are made"? This kind of question is what Vlad Korzinin set out to answer by building a better set of volume analysis tools that would better assist traders in knowing when truly supportive volume is in the market and truly resistive volume rears its head. MO' BETTER VOLUME Recall that the unified theory of volume suggests that in a bull market or a time when the prevailing or "Primary" trend is upward, volume will tend to expand as prices move higher. As the volume begins to wane and prices continue to advance, the theory suggests that the price trend is weakening and vulnerable to correction or even reversal. What modulated volume analysis suggests is that when true reversals are imminent, often what occurs is a surge of volume as the market moves higher, one that represents the final "piling-in" of buyers. With so many of the available buyers entering the market during such a surge, there are precious few buyers left to move the market higher. In technical analysis, this phenomenon is often called a blow-off top and is generally regarded as rare. What modulated volume analysis points to is that, with the proper perspective on volume, blow-off tops are far more common, even standard, ways for price trends to end. I mentioned volume moving averages (VMA) a few paragraphs back. The VMA is the key ingredient in MarketVolume's concept of modulated volume. The parameters of VMA can be adjusted, as with any moving average, and MarketVolume makes use of upside and downside VMA in analyzing volume in the marketplace. What is key about MarketVolume's approach to volume in general and the volume moving average in specific is that their analysis includes the entire trading volume for the components of the Standard & Poor's 500 (or NASDAQ or Dow Jones industrials) on a minute-by-minute basis. This, Vlad Korzinin is quick to point out, is different from what he calls merely a "history of the price paid for a basket of stocks" better known as the S&P 500.
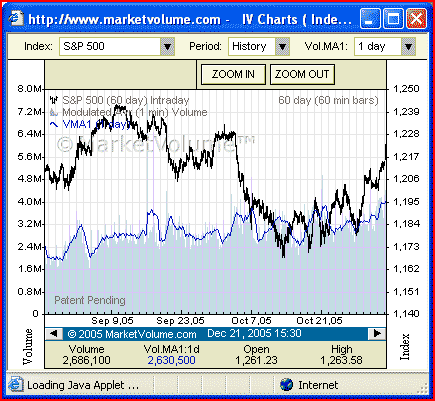
Figure 2: S&P 500, Hourly. VMA peaks as the S&P 500 heads lower in early October suggests supportive volume and the potential for strength in the weeks to follow.
And as far as Korzinin is concerned, this is a deal-making difference. Comparing two charts — one with traditional average volume and another with modulated — is the most graphic way to see the difference that modulated volume makes. In an average trading session, volume will tend to look U-shaped, with higher volume at the open, higher volume at the close with volume during midday tapering-off. Often, this volume pattern tends to hold even if there are rallies and declines in the market. In fact, this is almost a given for many traders when thinking about trading volume in most markets. A chart showing modulated volume will often look quite different, however. A modulated volume chart will show the volume attending a given market move, including a VMA spike, should volume during a particular advance or decline become especially pronounced. Says Korzinin: "Price can do tricky things. But volume never lies." Subscribers to MarketVolume's website have access to three different chart types: those focusing on intraday volume (IV charts), those focusing on market breadth (AD charts), and those focusing on the relationship between selling strength and buying strength (SBV charts). Having reviewed MarketVolume.com for Stocks & Commodities back in 2004, I'll urge readers to pick up a copy of the review from that issue for more specific information. Suffice it to say that each of these different chart types uses MarketVolume's modulated volume technique to provide a portrait of trading volume for the major market indexes that simply is not available from many (if any) other resources. While other volume analysts work and rework data on average volumes, MarketVolume is concerned primarily about volume behavior during trends. Is there a rising volume trend? Is there a VMA spike? If so, does it occur during a downtrend — suggesting the possibility of support — or during an uptrend — signaling the chance that the market has exhausted itself? "We have minute-by-minute history of volume going back to 1977," notes Korzinin. "Nobody is providing intraday volume for the indexes." Nobody, that is, until now.
David Penn may be reached at DPenn@Traders.com. Current and past articles from Working Money, The Investors' Magazine, can be found at Working-Money.com.
|
Technical Writer for Technical Analysis of STOCKS & COMMODITIES magazine, Working-Money.com, and Traders.com Advantage.
| Title: | Traders.com Technical Writer |
| Company: | Technical Analysis, Inc. |
| Address: | 4757 California Avenue SW |
| Seattle, WA 98116 | |
| Phone # for sales: | 206 938 0570 |
| Fax: | 206 938 1307 |
| Website: | www.traders.com |
| E-mail address: | DPenn@traders.com |
Traders' Resource Links | |
| Charting the Stock Market: The Wyckoff Method -- Books | |
| Working-Money.com -- Online Trading Services | |
| Traders.com Advantage -- Online Trading Services | |
| Technical Analysis of Stocks & Commodities -- Publications and Newsletters | |
| Working Money, at Working-Money.com -- Publications and Newsletters | |
| Traders.com Advantage -- Publications and Newsletters | |
| Professional Traders Starter Kit -- Software | |
PRINT THIS ARTICLE

Request Information From Our Sponsors
- StockCharts.com, Inc.
- Candle Patterns
- Candlestick Charting Explained
- Intermarket Technical Analysis
- John Murphy on Chart Analysis
- John Murphy's Chart Pattern Recognition
- John Murphy's Market Message
- MurphyExplainsMarketAnalysis-Intermarket Analysis
- MurphyExplainsMarketAnalysis-Visual Analysis
- StockCharts.com
- Technical Analysis of the Financial Markets
- The Visual Investor
- VectorVest, Inc.
- Executive Premier Workshop
- One-Day Options Course
- OptionsPro
- Retirement Income Workshop
- Sure-Fire Trading Systems (VectorVest, Inc.)
- Trading as a Business Workshop
- VectorVest 7 EOD
- VectorVest 7 RealTime/IntraDay
- VectorVest AutoTester
- VectorVest Educational Services
- VectorVest OnLine
- VectorVest Options Analyzer
- VectorVest ProGraphics v6.0
- VectorVest ProTrader 7
- VectorVest RealTime Derby Tool
- VectorVest Simulator
- VectorVest Variator
- VectorVest Watchdog


