

HOT TOPICS LIST
- Strategies
- Stocks
- Buy
- Investing
- Brokers
- Psychology
- Interviews
- Accumulate
- Sell
- Hold
- Spotlight
- Websites
- Candlestick Corner
- Gold & Metals
- Options Trading
LIST OF TOPICS
CANDLESTICK CORNER
Candlesticks And The J-Hook
01/04/06 02:10:15 PM PSTby Stephen W. Bigalow
Combine candlestick signals with technical patterns.
| Candlestick signals provide a tremendous advantage to investors when evaluating market trends. The implied logic built into the signals creates a platform that always places the probabilities in the candlestick investor's favor. Not only do the signals work well on their own, but applying candlestick signals to easy-to-recognize trading patterns also creates a platform for taking advantage of high-profit moves. Ever hear of the "Santa Claus rally"? It's the statistically expected rally that appears during the last few trading days of the year, but it doesn't happen every time. So how do you prepare an investment strategy that could take advantage of a strong, expected year-end move that may not occur? Candlestick signals and trading patterns provide a format with which to position a portfolio to exploit situations like the Santa Claus rally. HUMAN EMOTIONS Once you understand that candlestick signals capture emotions in a graphic depiction, you can take advantage of a crowd's known weaknesses. The knowledge you gain from examining candlestick charts can ultimately help you eliminate that same weakness and profit in your own investment decisions. Combining the candlestick technique with other technical methods increases your chances of success. THE JAY-HOOK
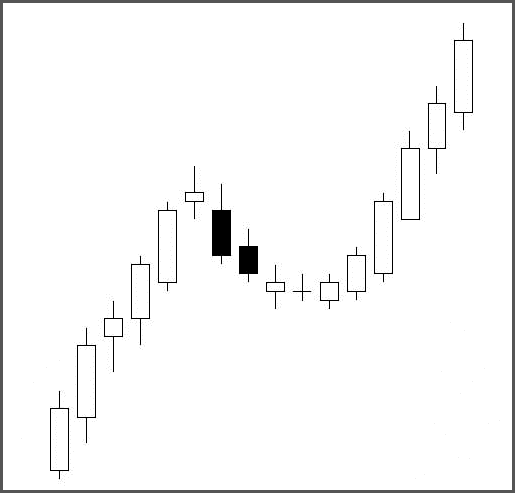
Figure 1: AN EXAMPLE OF A JAY-HOOK PATTERN. Note the pullback that eventually rounds out at the bottom and starts resuming the upmove.
The J-hook provides some simple profitable applications. The first uptrend usually shows candlestick sell signals when the initial upmove comes to an end. You could confirm this with other indicators such as oscillators. The top will form with the oscillator in the overbought area. When a J-hook sell signal becomes evident after the strong initial uptrend, you take your profits. IDENTIFYING THE J-HOOK Taking profit when the first sell signals occur eliminates the downside risk. Even though the strength of the initial move may indicate that a J-hook pattern may be in the process of forming, there is no guarantee the pullback could not retrace 20%, 40%, 60%, or more. When it is time to get out, don't hesitate! Get out! Suppose that small candlestick buy signals start to form after four days. There is nothing wrong with buying back into the position, as the trade's second entry now has clearly defined targets. The first target should be the of the recent high. Although it may not be a huge percentage return moving to that level, at least the probabilities indicate it should be profitable. Candlestick signals can also be applied if that recent high is tested. If another sell signal occurred as the price approached the recent high trading level, that would indicate that the recent high was going to act as resistance. In that case, you would take quick profits and get out of the trade. On the other hand, if you saw strong signals as the recent high was breached, that would indicate the high was not going to act as a resistance level; a new leg of the trend could be in progress. After a strong rally, we can expect a profit-taking period. Candlestick signals will allow you to better decipher whether the rally has ended. A full-scale reversal may have occurred, but seeing some candlestick buy signals after a few days of pullback allows you to formulate a strategy. That strategy should involve deciding whether to short in that market or reestablish long positions. TRADING WITH CONFIDENCE
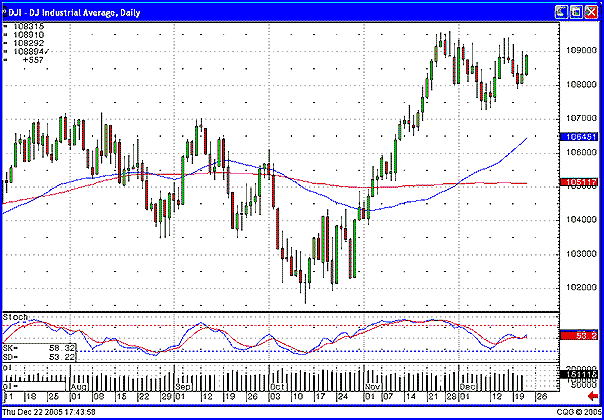
Figure 2: LOOK OUT BULLS. The Jay-hook pattern that you see forming in the Dow toward the end of the year is indicative of a year-end rally.
Once there is a possibility that a J-hook pattern could appear, you can get ready to move one way or the other. If short positions were established at the first sell signals, then you can prepare to cover those positions when the time comes. Individual stock positions can be evaluated with respect to the market trend when it comes to identifying a potential J-hook pattern. If, during a market uptrend, a stock price has moved up with greater magnitude than the trend in general, that becomes the first alert, since that stock trend is inordinately strong. A pullback occurring in that stock, when the market trend appears to be continuing, also gives rise to watching for a J-hook pattern to occur. The ability to correctly project the current market trend makes long-term investing, swing trading, and daytrading much more accurate. Being able to implement candlestick signals into established chart patterns dramatically enhances the accuracy of trend analysis.
Stephen W. Bigalow is an author and the principal of www.candlestickforum.com, a website that provides information and educational material about candlestick investing. RELATED READING Chart by CQG Current and past articles from Working Money, The Investors' Magazine, can be found at Working-Money.com.
|
Stephen W. Bigalow is an author and the principal of the www.candlestickforum.com, a website for providing information and educational material about candlestick investing.
| Website: | www.candlestickforum.com |
| E-mail address: | sbigalow@msn.com |
PRINT THIS ARTICLE

Request Information From Our Sponsors
- VectorVest, Inc.
- Executive Premier Workshop
- One-Day Options Course
- OptionsPro
- Retirement Income Workshop
- Sure-Fire Trading Systems (VectorVest, Inc.)
- Trading as a Business Workshop
- VectorVest 7 EOD
- VectorVest 7 RealTime/IntraDay
- VectorVest AutoTester
- VectorVest Educational Services
- VectorVest OnLine
- VectorVest Options Analyzer
- VectorVest ProGraphics v6.0
- VectorVest ProTrader 7
- VectorVest RealTime Derby Tool
- VectorVest Simulator
- VectorVest Variator
- VectorVest Watchdog
- StockCharts.com, Inc.
- Candle Patterns
- Candlestick Charting Explained
- Intermarket Technical Analysis
- John Murphy on Chart Analysis
- John Murphy's Chart Pattern Recognition
- John Murphy's Market Message
- MurphyExplainsMarketAnalysis-Intermarket Analysis
- MurphyExplainsMarketAnalysis-Visual Analysis
- StockCharts.com
- Technical Analysis of the Financial Markets
- The Visual Investor