HOT TOPICS LIST
- Strategies
- Stocks
- Buy
- Investing
- Brokers
- Psychology
- Interviews
- Accumulate
- Sell
- Hold
- Spotlight
- Websites
- Candlestick Corner
- Gold & Metals
- Options Trading
LIST OF TOPICS
DOW THEORY
2005 Recap
01/11/06 11:18:32 AM PSTby David Penn
The Dow averages entered the year in gear. But 12 months later, the transports and industrials were talking two different games altogether.
| One of the more exciting parts of Robert Edwards and John Magee's classic investment book, Technical Analysis Of Stock Trends, is chapter IV: "Dow theory in practice." This chronicle of the Dow Jones industrials and transports over the five years from the beginning of 1941 to the end of 1946 is an interesting-enough market history — insofar as it encompasses the period leading up and including to the US's participation in World War II. But of course, what makes the review so worth reading is the blow-for-blow analysis of the Dow industrials and transports through the lens of Dow theory. What I appreciate about "Dow theory in practice" is that it is one of the rare instances in which you can actually see and hear the mind of a speculator over the course of various sequential market campaigns. As helpful as it can be to read an account, for example, of a professional trader's navigation of the crash of 1987 or the peak years of the dotcom era in 1998 and 1999, often these accounts contain a singular (usually redemptive) message. Moreover, such retellings tend to be heavy on the emotion and light on the analysis. This is an understandable approach — who can resist the drama, the desk-overturning, the phone receivers flung across the office, as hundreds of thousands, millions or more are won or lost? But for the trader — especially the technical trader — who is seeking more knowledge than entertainment, what is most valuable is not the voice of the trader, but the voice of the trade. When did the buy and sell signals come? Were they clear and unambiguous? Or were those signals halting and occasionally indecipherable? What about signal reversals when a buy signal is followed immediately by a sell signal, which is then followed by another buy signal and then another sell? At the beginning of "Dow theory in practice," Edwards and Magee write that "we can better organize our knowledge of the Theory and acquire some understanding of its interpretation by following through a few years of market action and seeing how it looked at the time through the eyes of a Dow Theorist." A similar, though more modest, goal is attempted here: a chronicle of 2005 through the lens of the Dow industrials and transports. Edwards and Magee note that the 194146 period of their study "covers the end of one Bear Market, an entire long Bull Market and part of another Bear Market..." Again more modestly, 2005 affords the Dow theorist with examples of confirmations and nonconfirmations, both simultaneous and delayed, as well as breakouts, breakdowns, and consolidations (or "lines," as Dow theory traditionalists call them). Other technical non-Dow theory events such as stochastic and moving average convergence/divergence (MACD) histogram divergences will also be noted as they occur. CRASH, PEAK, AND CRASH Both averages — come late January — had also formed bullish positive divergences in their MACD histograms. This action was confirmed by bullish positive divergences in the stochastic, setting up the likelihood that a significant bounce would come from the late January lows. Again tightly in gear with each other, both the industrials and transports rose from their early-year lows to make new highs for the year in early March. As the two averages were in fact topping from March 3 through March 7, it must have appeared as if the January decline was merely the correction the strong end-of-2004 rally needed to relieve overbought conditions and pave the way for further progress higher. This might have been especially so in the case of the transports, which on March 7 recorded an all-time closing high just north of 3876. Ominously enough, the industrials began in early March to show weakness in the form of negative MACD histogram and stochastic divergences. These divergences were not mirrored in the transports — a fact that could later perhaps be attributed to the relatively stronger transportation average (a strength that would become abundantly clear only later in the year). But whatever differences the two averages had vis-à-vis their respective MACD histograms and stochastics, there was no difference when it came to putting in the first major low of the year. This low, as seasonality would have it, occurred in April, as the two averages ran out of steam in early March and began falling. A bearish confirmation between the two averages occurred on April 14, as the industrials and transports simultaneously closed below the level of the January lows. SUMMER'S THERE AND BACK AGAIN RALLY
This is talked about almost as much as the Santa Claus rally, but it is a dubious concept. Sure, stocks tend to rally at least once in most seasons, but historically, summer tends to be a weak period. Stocks tend to bounce up and down over the summer and hit bottom in September or October. September, historically, is the worst month for stocks, the only one that averages a noticeable decline. Summer tends to end with a thud.
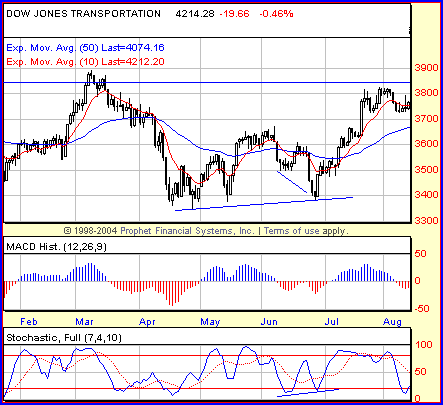
Hence, the market maxim "Sell in May and go away." If nothing else, Browning had the summer of 2005 dead to rights. May 2005 was a month of zigzags, as the averages both struggled to rally from the spring lows. May 18 was the date that both the industrials and transports simultaneously surpassed the highs from the first half of the month, highs that represented a sort of "break-free" (if not breakout) from the depths of the spring lows. I hesitate to say "breakout," because even as the averages moved higher through May and into June, declines beginning in early June (transports) and late June (industrials) saw the averages retrace a significant amount of the rally from the spring lows. It's important to note, however, that the July lows represented higher lows vis-à-vis the spring. These "higher lows," in and of themselves supported the argument for higher prices in both the transports and industrials over the balance of the summer.
Figure 1: Dow Jones Transportation Average, Daily. A simple higher low in the late June decline was one sign that higher prices were likely going forward in the transportation average. Note also the positive stochastic divergence in June that similarly suggests price gains.
Unfortunately, as sharp as the rally from the summer lows was, the rally was relatively anemic. How so? While accompanied by positive stochastic divergences in both cases, the rallies in the industrials and transports set new highs for the summer but failed to set new highs for the year. While seemingly such a high hurdle, such an achievement would nonetheless have been the sort of thing upon which a speculator or investor could hang his or her hat. But in the same way that the higher low in late June suggested the possibility of upwardly trending prices, so did the lower high in July keep open the possibility that trendlessness — or worse, lower prices — would return. And for a period in August and September it looked as if those lower prices were the more likely outcome. Gradually in the case of the transports, somewhat more fitfully in the case of the industrials, the averages bled value over the late summer — appearing quite ready to produce the sort of "thud" that Browning warned about. After an abortive bump in both averages in late September saw the transports set a new high for the month but the industrials fail to do so (setting up a very short-term nonconfirmation between the two), the averages sagged lower into October.
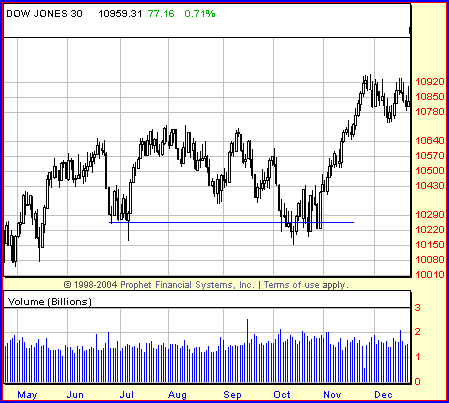
Figure 2: Dow Jones Industrial Average, Daily. The Dow 30 closed beneath the lows of the summer during their October decline, setting up a nonconfirmation with the Dow Jones Transportation Average, which managed to hold above the summer lows during its autumn correction.
But "sagged" was more operative in this instance than, say, "collapse," or perhaps even "thud." The transports made intraday lows that surpassed those of the summer. On a closing basis, however, the transports managed to hold above those levels, creating, however modestly, still higher lows. The industrials, for their part, did make closing lows below the summer lows. This nonconfirmation — in the context of a market in a general downtrend — put a question mark on the possibility (or likelihood) of further declines. This is the opposite of what happens when there is a nonconfirmation in the context of an uptrend, during which the possibility of additional gains needs to be questioned. BOTTOM, BOUNCE, AND DIVERGENCE The capacity to not believe what you see must be one of the most endearing traits of those of us who from time to time find ourselves giving more money to the market than taking it. But as the markets were sliding execrably lower over the course of September 2005, those who had been long-awaiting the market-shattering ka-boom couldn't have felt any stronger that The Moment was at hand. The summer rallies in the Dow industrials and transports had fizzled out without setting a new high for the year. And bearish eyes were no doubt sizing up the summer lows in both averages as the most likely next location of the Dow's all-but-assured negative confirmation. Not! Technical indicators far better telegraphed the bottom in the transports than the one in the industrials. In fact, there is an argument that there was no technical "early warning" in the industrials — no positive divergence in the MACD histogram and no positive divergence in the stochastic. The Dow theory nonconfirmation between the industrials and the transports previously mentioned — in which the transports failed to close below the summer lows while the industrials did — in and of itself warned that the current trend (downward) was in danger. The only sign that the nonconfirmation might actually turn into a significant bounce — let alone an outright reversal — came from a positive stochastic divergence in the transports. Although this stochastic divergence was not confirmed by a similar divergence in the industrials, the context of the Dow theory nonconfirmation made it worthwhile for speculators to begin looking into the transports — airlines, rails, and trucks, as well as leading transportation average stocks like FedEx and UPS — for signs of strength.
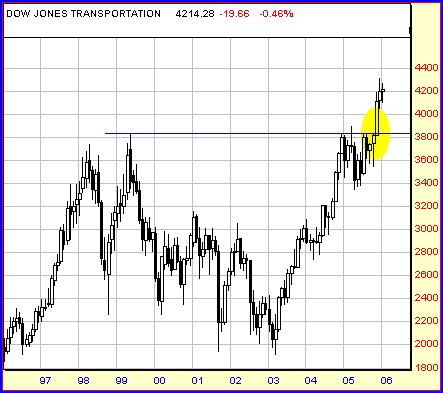
Figure 3: Dow Jones Transportation Average, Monthly. The transports spent the last month of 2004 and much of 2005 attempting to set a new all-time high vis-à-vis the 1999 peak. In November 2005, that new all-time high was finally achieved.
Strength was clearly the order of the day in November 2005, as both the transports and the industrials shot up from their October lows like carnival daredevils from a cannon. Even in this, however, the transports led. While the transports ended October with a new high for the month, it took the industrials until November 10 to best their October highs. Similarly, while the industrials took out their summer highs in mid-November, the transports had not only taken out their summer highs several days previously, but also had embarked upon a mission to take out all-time closing highs set earlier in the year. Nevertheless, these moves still served as positive or bullish confirmations. Recall that as far as confirmations go:
It is not necessary that the two averages confirm on the same day. Frequently both will move into new high (or low) ground together, but there are plenty of cases in which one or the other lags behind for days, weeks, or even a month or two. One must be patient in these doubtful cases and wait until the market declares itself in definite fashion.
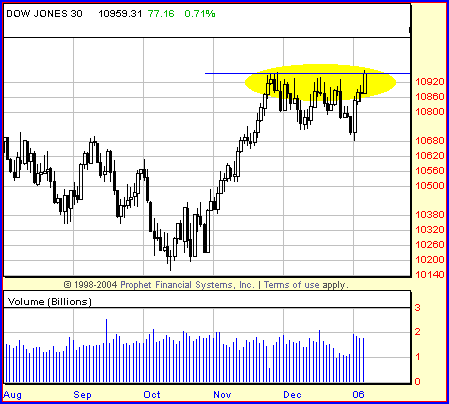
Both averages put in tops in late November at almost the exact same time (November 25) and moved into sideways consolidations or "lines" going into December. Once again, however, it was the transports that were the first to signal that further price gains might be had. Breaking out to set a new high for the move — as well as a new all-time closing high — in late December, the transports appeared at first to be flirting with a nonconfirmation insofar as the industrials continued to move sideways. Nevertheless, as had become a pattern since the post-October rally began, the transports were leading rather than diverging. On January 6, 2006, the industrials made a closing high for the move since October, taking out the November high and confirming the move higher in the transports. Of late, it has become the transports turn to move sideways, skating along the support provided by its 10-day exponential moving average (EMA).
Figure 4: Dow Jones Industrial Average, Daily. After five weeks of sideways-to-downward consolidation, the Dow 30 managed a new closing high in November for the move since the October lows. Follow-through to the upside will be crucial for the breakout to be valid.
Where does all this leave the averages now? As of the first week of January 2006, there is a positive or bullish confirmation in the averages. This bullish confirmation is based on the averages breaking out above the November highs. The fact that the transports did this in December 2005 while the industrials accomplished this feat later, in January 2006, is of no real matter. What is important is that both averages have moved to new high territory in recent weeks and those that choose to fade this move by shorting on anything more than an intraday or swing basis (that is, three- to five-day) are, to steal a phrase, spitting in the wind at best and tugging on Superman's cape at worst.
David Penn may be reached at DPenn@Traders.com. ‡ Prophet Financial SUGGESTED READING Current and past articles from Working Money, The Investors' Magazine, can be found at Working-Money.com.
|
Technical Writer for Technical Analysis of STOCKS & COMMODITIES magazine, Working-Money.com, and Traders.com Advantage.
| Title: | Traders.com Technical Writer |
| Company: | Technical Analysis, Inc. |
| Address: | 4757 California Avenue SW |
| Seattle, WA 98116 | |
| Phone # for sales: | 206 938 0570 |
| Fax: | 206 938 1307 |
| Website: | www.traders.com |
| E-mail address: | DPenn@traders.com |
Traders' Resource Links | |
| Charting the Stock Market: The Wyckoff Method -- Books | |
| Working-Money.com -- Online Trading Services | |
| Traders.com Advantage -- Online Trading Services | |
| Technical Analysis of Stocks & Commodities -- Publications and Newsletters | |
| Working Money, at Working-Money.com -- Publications and Newsletters | |
| Traders.com Advantage -- Publications and Newsletters | |
| Professional Traders Starter Kit -- Software | |
PRINT THIS ARTICLE

Request Information From Our Sponsors
- StockCharts.com, Inc.
- Candle Patterns
- Candlestick Charting Explained
- Intermarket Technical Analysis
- John Murphy on Chart Analysis
- John Murphy's Chart Pattern Recognition
- John Murphy's Market Message
- MurphyExplainsMarketAnalysis-Intermarket Analysis
- MurphyExplainsMarketAnalysis-Visual Analysis
- StockCharts.com
- Technical Analysis of the Financial Markets
- The Visual Investor
- VectorVest, Inc.
- Executive Premier Workshop
- One-Day Options Course
- OptionsPro
- Retirement Income Workshop
- Sure-Fire Trading Systems (VectorVest, Inc.)
- Trading as a Business Workshop
- VectorVest 7 EOD
- VectorVest 7 RealTime/IntraDay
- VectorVest AutoTester
- VectorVest Educational Services
- VectorVest OnLine
- VectorVest Options Analyzer
- VectorVest ProGraphics v6.0
- VectorVest ProTrader 7
- VectorVest RealTime Derby Tool
- VectorVest Simulator
- VectorVest Variator
- VectorVest Watchdog


