HOT TOPICS LIST
- Strategies
- Stocks
- Buy
- Investing
- Brokers
- Psychology
- Interviews
- Accumulate
- Sell
- Hold
- Spotlight
- Websites
- Candlestick Corner
- Gold & Metals
- Options Trading
LIST OF TOPICS
THE CHARTIST
The Bowl Pattern Breakout
02/17/06 10:45:00 AM PSTby Sharon Yamanaka
The winner for 2005!
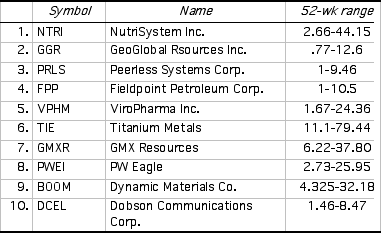
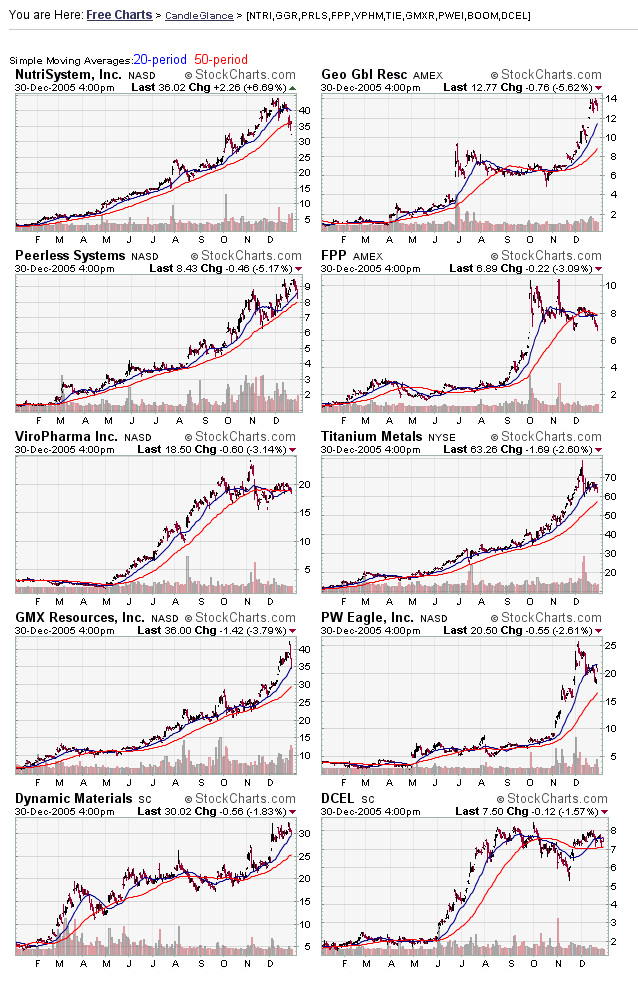
It's a touchdown for the bowl pattern breakout! Seven, count 'em, seven of the top 10 stocks for 2005 (MSN Money Power Searches) were from this modest, even marvelous, pattern. (See Figure 1.)
|
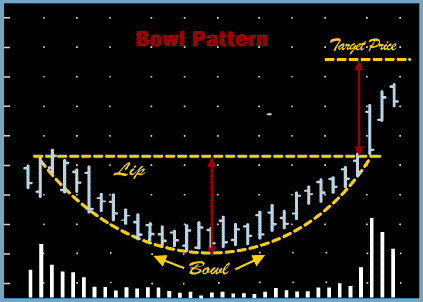
| It seems obvious, but I would never have thought of it if I hadn't seen it on the TheKirkReport.com under the heading "Research Missed Opportunities." I go to TheKirkReport.com, named as one of Forbes' "Best of the Web," several times a day to see what a professional trader who has the ability to sort through masses of financial information at the speed of, well, a speed reader has to say about not only up-to-the-minute market conditions, but with the occasional entertaining or thought-provoking entry as well. He suggested it was a good idea to take a look at last year's winners and figure out why they did so well. I didn't expect to come up with a definitive answer, but the bowl pattern, breaking out on 52-week highs, consistently showed up on last year's winners. The bowl pattern is exactly what it sounds like -- a rounded pattern that gives a buy signal when the stock price exceeds the lip of the "bowl." The breakout should occur on high volume, at least doubling the low volume from the dip. This pattern typically takes a long time, six months to a year, to develop and once the breakout occurs, the stock should rise to the equivalent of the price from the bottom to the "lip" of the bowl (Figure 2).
For the 2005 winners, the breakouts occurred on 52-week highs of the stocks' prices. In his book Encyclopedia Of Chart Patterns, Thomas Bulkowski tested and rated the various patterns, and the rounded, or bowl, pattern was the second most likely to rise, with a 54% chance to rise 20% or more. Even if a stock isn't the next big winner, it's a big bonus if you have a better than average chance of making money on the trade. Beyond the breakout pattern, logically the top 10 stocks should have strong fundamentals and it's important to know exactly what made them go up. So in retrospect, I followed the trail of news releases and earnings reports fueling their growth. NTRI: WE'RE NO. 1 Straight from the first line of its website's "About Us" link, "NutriSystem, Inc. has been helping America get thin and healthy for the past 30 years." So why at the tail end of 2004 did NTRI suddenly take off?
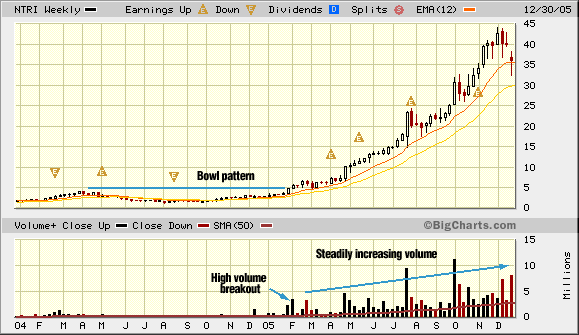
Figure 3 shows a two-year chart of NTRI with the bowl pattern starting in March 2004 and completing almost a year later in February 2005. Following the news headlines, in December 2004, NutriSystems acquired Slim and Tone, a franchiser of women's express workout centers. At the same time they released their third-quarter financial statement, which revealed the company had turned a profit, reversing years of losses. This caused a momentary flurry as volume, more than price, spiked on the news. The stock price slowly rose until February 2005, when it broke through the 52-week high and completed the bowl pattern. From there, as they say, the rest is history. The stock continued to climb from the breakout point of 4 to reach a high of 44.15 in December 2005, ending the year at 36.02. The question: How would I have known to get in? And just as important, when do I get out? |
WHAT WOULD I HAVE DONE? Hindsight being 20/20, I can map out a theory and match it with the chart action. Most traders do some sort of stock screening in order to find viable stocks for their portfolio. Some of the screens are for unusual volume, highs and lows of various sorts, or moving average crossovers and other technical indicators, to name a few. I used a "largest percent gain" screener that lists the stocks with the highest gains for the day. I assume I overlooked this stock because something else looked better whenever it appeared on the screen. So to notice this stock, I would have had to start with a 52-week high screen. That would have caught this stock when it broke out above $4. On looking at the chart, I would have seen the high volume on the breakout and the completion of the bowl pattern. From there I would have checked the fundamentals and seen that the company had just turned a profit and was expanding to include gyms. If I decided to buy, the next step would have been setting up the trade.
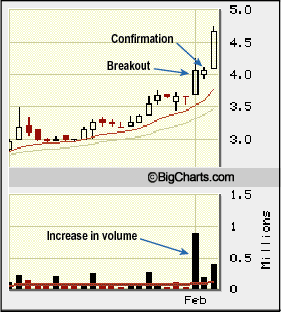
For a bowl-breakout pattern, you would buy after the stock closes above the breakout point and confirms the breakout. This occurred on the second day after NTRI closed above $4 (Figure 4). I would have bought in on the next day if the stock had continued rising. Once in, I would place a stop, a generic 8% trailing one or customize one for NTRI. That would give me a conservative 40 cents for the 8% stop, or a more generous 65 cents for a stop that is larger than the largest single-day's trading range, keeping me from getting stopped out by daily noise. Another possible stop based on the chart pattern would be below the breakout point of $4. Finally, I would set my target at $6; the bowl pattern had formed on a base at $2 and broken out at $4 for a depth of $2. I would look for a $2 gain from the breakout point of $4. Once past $6, I would tighten my stop considerably or just move it up to 6.
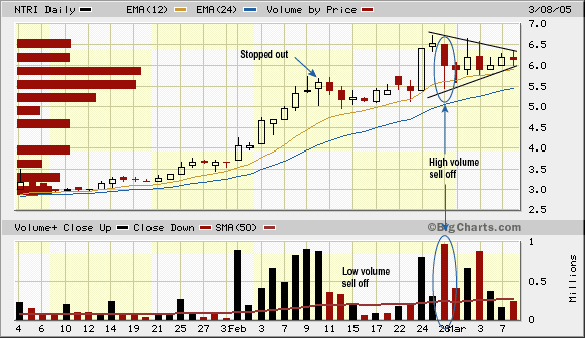
So, once I decided what I would have done, I checked to see what NTRI actually did. It continued to rise until March (Figure 5), when it consolidated. I would have been stopped out around $5 using any of the first two methods I mentioned. So buying at $4.10 and selling, at worst, at $5 would have been about a 25% gain. But this would have been a low-volume selloff, volume being indicative of intent, and there wasn't much power to this price drop. In my list of the top 10 stocks, I included information on institutional ownership, this being mutual funds, money managers, and other large buyers and sellers, or block traders. Usually, it's these buyers that cause stock prices to increase at large and continual rates. The amount of NTRI stock owned by institutions started 2005 at zero and ended at 66%. So the low-volume selloff indicated that institutional buyers weren't selling and expected the stock to continue to rise. Returning to the stop, if I'd acted on my third option and placed the stop below the $4 level, I would have stayed in the trade and sold later on at the beginning of March. This time the stock dropped on high volume when it hit $6.50 -- 50 cents past my $6 target. That would have been the right place to sell based on the bowl pattern, and that seems to be what a lot of people did. I also took into consideration what the market was doing at the time. From early March, when I theoretically sold, to mid-April, the Dow Jones Industrial Average (DJIA) dropped almost 1,000 points from about 11,000 down to 10,000. It would have taken some aggressive trading to buy back into the stock. NTRI hit a new high on April 7, but the big upward break came on April 26 when NTRI gapped up, opening at $8.50 before closing at another 52-week high of $7.14. This was on huge volume and would have been the safest time to buy back. The DJIA was also rising from a severely oversold position, so I would have continued trading the stock, with the next big consolidation in August, then another in September. But wait a minute: I could have bought NTRI on the first breakout at $4 and held it until the end of the year. Was there any way I could have known to do that? WHAT WOULD HAVE KEPT ME IN? To have held this stock through all the ups and downs, I would have had to be a value or growth investor. I would have checked the fundamentals on their quarterly reports, not the day-to-day stock price or chart patterns. The catch is that most value investors wouldn't buy what was then a thinly traded stock under $5. But assuming NutriSystems came to my attention, I would have looked more closely at its fundamentals. One approach is outlined by Pat Dorsey, director of stock analysis for Morningstar in his book The Five Rules For Successful Stock Investing. His five rules are:
|
Starting with NutriSystem's cash flow, Dorsey says to look at the "Total cash flow from operating activities" line on a company's annual report. In the beginning of January, NutriSystems' cash flow was: Dec-31-04 Dec-31-03 Dec-31-02 For the company, 2004 was a turnaround year as their negative cash flow from the previous year turned positive in 2004. Next, I checked sales (revenues). Free cash flow divided by sales gives the amount of each dollar's revenue that the firm is able to convert into excess profit. According to Dorsey, "Five percent or better is a cash machine." For NTRI, that was $2,795 (cash flow) minus $688 capital expenditures equaled $2,107 free cash flow. From there I went to the income statement for total revenue, $37,996, and divided that into $2,107 for 0.0554 or 5.54%.
Third, net margins (net income divided by sales) for NTRI was 1,019 divided by 37,996 = approximately 3%. ROE was 9.4% and ROA 6.4%. NTRI didn't meet Dorsey's last three rules for a sound investment. But the eye-popping, jaw-dropping revenues line on the company's quarterly report (Figure 6) tells the story. Going into 2005, each quarter of 2004 exceeded the previous year's by at least 50%. Revenues for 2005 at least doubled, while third-quarter revenues increased eight-fold from 7.66 to 64.52 million from the previous year. Apparently, figures like that trump ROAs and ROEs. Following the news releases, NutriSystems closed all its brick-and-mortar storefronts and became a strictly online business. They also started to offer 24-hour coaches to their dieting clients. Their prepackaged food, ordered online and delivered to customers' doorsteps, seemed to be a winning combination, both for the company and the dieters, as revenues continued to rise throughout the year. They also started a new marketing campaign, and in their annual report credited their stepped-up advertising for their increased sales. DO I WANT TO DO THAT? Over a 30-year period, Morningstar's approach averages 9% a year; you need to average 14% to offset taxes and brokerage fees in active trading in order to beat the long-term 9% growth rate. The National Association of Investors Corp. (NAIC), a nonprofit investment club organization, reports that the average NAIC investment club achieves 17.9% return on its investments and beats the market about 60% of the time. Club members tend to hold stocks for about six years. Because of their conservative approach, I doubt the likes of NTRI would have made it into their portfolios. But I want to develop a trading style that includes the quick 25% gain from NTRI's bowl pattern breakout. So in my final analysis, based on my time frame and my tolerance level, I've decided to go back to my original trading style and buy in and out of the stock based on its chart pattern, taking into account the phenomenal growth in revenue. I could be more liberal in setting my stops and buying in and out of the stock. While I'm not getting stopped out prematurely, I'm still out of the market when the stock is consolidating or when the market is going down. I've reduced my risk and taken smaller profits. I'm splitting the difference between exiting at the first downturn and going whole-hog, long term on companies rising on quarterly reports and bombshell news releases. That's like a person living from paycheck to paycheck. Miss one month and everything collapses into debt. I want in, but not really, really in, because for every NutriSystems that beats earnings and posts triple-digit returns, there are hundreds of other companies that fail to follow through. In my next article, I'll look at setting up a screening system for bowl patterns and a look at the other nine stocks. Sharon Yamanaka can be reached at Syamanaka@Traders.com. Current and past articles from Working Money, The Investors' Magazine, can be found at Working-Money.com. |
| Title: | Staff Writer |
| Company: | Technical Analysis, Inc. |
| Address: | 4757 California AVE SW |
| Seattle, WA 98116 | |
| Phone # for sales: | 206 938 0570 |
| Fax: | 206 938 1307 |
| Website: | www.Working-Money.com |
| E-mail address: | syamanaka@traders.com |
Traders' Resource Links | |
| Charting the Stock Market: The Wyckoff Method -- Books | |
| Working-Money.com -- Online Trading Services | |
| Traders.com Advantage -- Online Trading Services | |
| Technical Analysis of Stocks & Commodities -- Publications and Newsletters | |
| Working Money, at Working-Money.com -- Publications and Newsletters | |
| Traders.com Advantage -- Publications and Newsletters | |
| Professional Traders Starter Kit -- Software | |
PRINT THIS ARTICLE

Request Information From Our Sponsors
- StockCharts.com, Inc.
- Candle Patterns
- Candlestick Charting Explained
- Intermarket Technical Analysis
- John Murphy on Chart Analysis
- John Murphy's Chart Pattern Recognition
- John Murphy's Market Message
- MurphyExplainsMarketAnalysis-Intermarket Analysis
- MurphyExplainsMarketAnalysis-Visual Analysis
- StockCharts.com
- Technical Analysis of the Financial Markets
- The Visual Investor
- VectorVest, Inc.
- Executive Premier Workshop
- One-Day Options Course
- OptionsPro
- Retirement Income Workshop
- Sure-Fire Trading Systems (VectorVest, Inc.)
- Trading as a Business Workshop
- VectorVest 7 EOD
- VectorVest 7 RealTime/IntraDay
- VectorVest AutoTester
- VectorVest Educational Services
- VectorVest OnLine
- VectorVest Options Analyzer
- VectorVest ProGraphics v6.0
- VectorVest ProTrader 7
- VectorVest RealTime Derby Tool
- VectorVest Simulator
- VectorVest Variator
- VectorVest Watchdog

