HOT TOPICS LIST
- Strategies
- Stocks
- Buy
- Investing
- Brokers
- Psychology
- Interviews
- Accumulate
- Sell
- Hold
- Spotlight
- Websites
- Candlestick Corner
- Gold & Metals
- Options Trading
LIST OF TOPICS
THE OPTIMIZED TRADER
Dial "D" For Divergences
03/08/06 03:11:04 PM PSTby David Penn
Are all divergences created equal? Here's some instruction for catching turns in market direction.
For many traders, spotting technical divergences between two markets that usually trade together, or between a market and a key technical indicator, or between a pair of key indicators is the equivalent of being able to drive in the high-occupancy vehicle (HOV) lane during a congested commute. In other words, divergences don't get you anywhere you probably weren't headed to soon enough anyway. But if you want to get there faster, divergences can often show the way. Consider a classic divergence scenario: a market makes a new price high after a significant period of upwardly trending prices. However, a key technical indicator matches that new high in price with a lower high in the indicator. On its face, this is generally considered a bearish sign insofar as such divergences are referred to as negative divergences. In the face of such a divergence, a trader or investor might cut back a long position, sell the entire position, or even go short. For some traders, however, this would be considered premature. Some traders and investors might require a price breakdown before selling or going short (as opposed to taking a bearish position while the market is still making new highs). Perhaps those more cautious traders need a trendline break, or a close (or series of closes) below a significant moving average. The point is that the more cautious trader -- stuck in one of the four regular driving lanes -- might arrive at the same conclusion as the trader keying on the negative divergence (that is, a decision to sell an old position or short a new position). But given the first trader's methodology, he or she will do so after the divergence trader. In fact, it might even become the case that by the time the more cautious trader is going short, the divergence trader already may be looking to cover a position at a profit. A DIVERSITY OF DIVERGENCES The idea of divergences is tailor-made for the visual approach of technical analysis. Introducing the concept in his book The Visual Investor, author and trader John Murphy describes divergences succinctly: In other words, we study two lines that usually trend in the same direction. When they start to diverge from one another, the analyst begins to suspect that the trend is losing momentum. Oscillators are especially helpful for this purpose. As I mentioned at the outset, those "two lines" can be prices and an indicator, two sets of prices or two sets of indicators. While the first type is probably the one that most traders and investors are familiar with -- such as when a market makes a new high but the stochastic oscillator fails to do so -- the other two types of divergence have their adherents as well. Most traders are familiar with Dow theory, which presents a variety of rules and methods for interpreting market action -- many of which, such as the idea that the averages discount everything, have become fundamental building blocks in our understanding of how technical analysis works. However, one of the key aspects of Dow theory involves the idea of confirmation that, to quote Robert Edwards and John Magee from their classic technical trading tome, Technical Analysis Of Stock Trends, "No valid signal of a change in trend can be produced by the action of one average alone." Confirmation, as Murphy points out, is merely the opposite of divergence. And it is those instances of divergence between the two averages -- with one average making new highs while the other "fails to confirm" by making a new high of its own -- that are among the clues used by Dow theorists to evaluate the strength and direction of the market. Indicator-indicator divergences are arguably less common than price-indicator and price-price divergences. But many traders and investors use one indicator or oscillator to confirm the behavior of another. John Murphy, again in The Visual Investor, notes and shows examples of indicator combinations such as the relative strength index (RSI) and stochastics or the moving average convergence/divergence (MACD) and stochastics, writing that "it's always best to combine indicators. Each of these oscillators can be used by itself, but their value is enhanced when they are used together." DIVERGENT EXPERIENCE In practice, divergences can be trickier than the simple idea of "higher high in price, lower high in indicator" might make it seem. While some instances are clear-cut, with two peaks in price (sticking with uptrends for simplicity's sake) matching up with two peaks in a given indicator, other situations are less clear -- with intervening peaks, indicator peaks that don't line up with price peaks, "running" or multiple peak indicators as new highs in price are followed by still-higher highs. Toward this end, technical analysts have worked to characterize the various sorts of divergences that traders are likely to encounter in the markets, and to provide a sense of what these different types of divergence mean for the markets in which they happen. 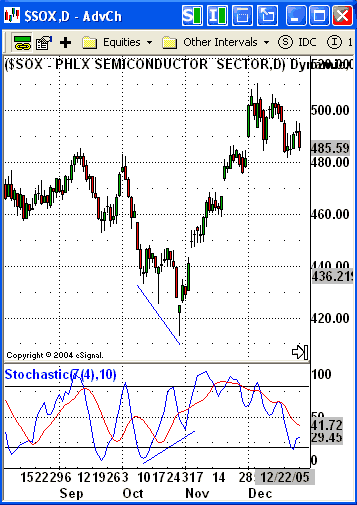 Figure 1: Philadelphia Semiconductor Sector Index, Daily. An example of an "orthodox" positive or bullish divergence between price action and the stochastic indicator. |
Alexander Elder, in his book Trading For A Living, for example, cites three different "classes" of divergence for both the bullish and bearish cases. His approach provides for a "weakest," "strong," and "strongest" typology of divergences that can help traders analyze not only the likelihood that a given divergence will lead to a given reversal, but also in determining the amount of risk a trader is willing to undertake in pursuit of the anticipated reversal. Elder posits as the "strongest" type of bearish divergence that instance in which prices make a new high, while the indicator or oscillator makes a lower high. This is what most technical and even many knowledgeable nontechnical traders know and understand when the subject of divergences comes up. However, Elder introduces another pair of divergences that traders should be on the lookout for, even if the signals they provide are not considered as strong as those from the first divergence type I mentioned. These include what might be called the "price double top" bearish divergence (or "price double bottom" bullish divergence) and the "indicator double top" bearish divergence (or "indicator double bottom" bullish divergence). The price double top bearish divergence occurs when prices make a high, pull back, and then make an identical high (thus forming a double top), while the indicator or oscillator is simultaneously forming a new high then a lower high. Elder considers this a strong sell signal, but not as strong as the signal provided by the more conventional, higher high in price/lower high in the indicator type of bearish divergence. 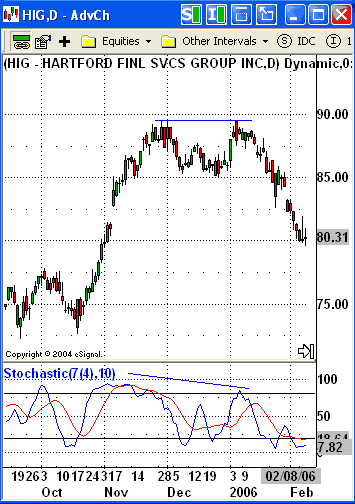 Figure 2: Hartford Financial Services Group, Daily. A double top negative or bearish divergence has equal price peaks, but lower highs in the indicator. |
The last kind of divergence in Elder's classification of divergences is what I've referred to as the "indicator double top" bearish divergence. In this situation, prices make a new high, then go on to make a higher high. At the same time, however, the indicator or oscillator is making a high and then an equal high -- in effect, creating a double top. This class of divergences is Elder's least favorite, suggesting that these "Class C" divergences (and the price double top/bottom divergences as well) "more often lead to whipsaws" and that "it is beset to ignore them, unless they are strongly confirmed by other indicators." 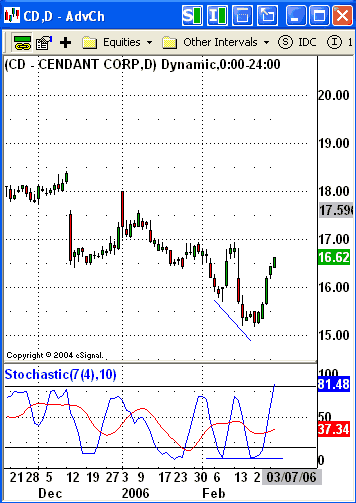 Figure 3: Cendant Corp., Daily. An "indicator double bottom" positive or bullish divergence has lower price troughs, but equally low indicator troughs. Elder considers "indicator double bottom" and "indicator double top" divergences to be among the weakest of divergences. |
DOUBLING DOWN AND OTHER DIVERGENT TAKES Another interesting take on divergences comes courtesy of Rick Ackerman: writer, trader, and proprietor of Rick's Picks, an e-newsletter trading advisory service. In an essay titled "Stochastics Made Simple," Ackerman not only discussed what makes one of the more commonly used and relied-upon indicators actually tick, but he also wrote about how divergences in the stochastic could most profitably be evaluated. Fortunately for those traders who prefer other sorts of oscillators -- such as RSI, MACD, momentum, Williams' %R, the commodity channel index (CCI) and so on -- most if not all of what Ackerman has to say about divergences in the stochastic applies equally well to divergences in other oscillators. For Ackerman, there are two types of divergent top (again, sticking with uptrends and tops here). The first is the "orthodox" bearish divergence that occurs when prices make a new high, then a higher high while the indicator/oscillator makes a new high and then a lower high. Writes Ackerman of this type of bearish divergence: A useful way to interpret this is to say that, as the stock went higher, the eagerness of buyers diminished. Or you could say that the second rally, while producing a higher price peak, failed to get as overbought as the first. This is an intuitively bearish proposition ... The other type of divergent top that Ackerman is concerned with is one in which prices make a new high and then a lower high, while the indicator/oscillator makes a new high and then a higher high. I had never heard an interpretation of this sort of bearish divergence before, even though, like most technical traders, I have run into this sort of situation and wondered if, since "lower highs in price/higher highs in oscillator" was the exact opposite of the orthodox bearish divergence already discussed, was this lower highs in price/higher highs in oscillator" phenomenon actually a bullish than a bearish sign? Ackerman says no, and suggests a way of looking at this kind of scenario: Think of it as implying that the stock got even more overbought while failing to make new highs. You could also see it as a "distributive" pattern, where buyers expended a good deal of enthusiasm -- rendered the stock "overbought," that is -- without being able to push it to new price highs. 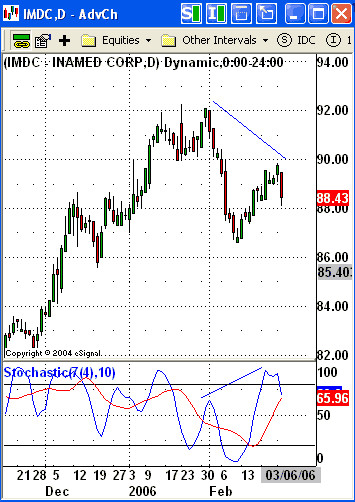 Figure 4: Inamed Corp., Daily. Lower highs in price with higher highs in the indicator? Rick Ackerman alerts traders to this type of bearish or negative divergence. |
One type of divergence that both Elder and Ackerman address is the multiple or running divergence. In these instances -- again, taking the case of the uptrend as an example -- prices make a new high, and then go on to make subsequent new highs, often creating a trail of three or four ever-higher peaks. At the same time, the oscillator or indicator is steadily making lower highs. Each time there is a new high in price, there is a new lower high in the indicator. What is tricky about these divergences -- especially for aggressive divergence traders -- is that often a trader will attempt to short the first of the divergences, only to get stopped out as the market moves on to make a higher high (and yet another bearish divergence). Writing about such multiple divergences -- or more specifically, what he calls "triple" divergences -- Elder suggests such events are worth watching for: Triple ... divergences ... are even stronger than regular divergences. In order for a triple divergence to occur, a regular ... divergence first has to abort. That's another good reason to practice tight money management! If you lose only a little on a whipsaw, you will not suffer -- and you will have both the money and psychological strength to re-enter a trade. Ackerman adds to this, noting that while often traders will be confronted with successively higher price peaks and successively lower oscillator peaks as multiple divergences are forming, on occasion the peaks will be more scattered, with an initial price peak that is followed by a lower price peak then a third price peak that is higher than the previous two. Meanwhile in the oscillator, a peak is followed by a higher peak that is followed by a peak that is lower than the previous two. Ackerman points out that even in his topsy-turvy assortment of higher and lower peaks, there is a method to be derived from the maelstrom. What is distinctive about this chart is that all of the respective peaks diverge from each other ... This pattern is relatively rare, but when you see it taking shape on a chart, you should fasten your seatbelt in preparation for a wicked turn.
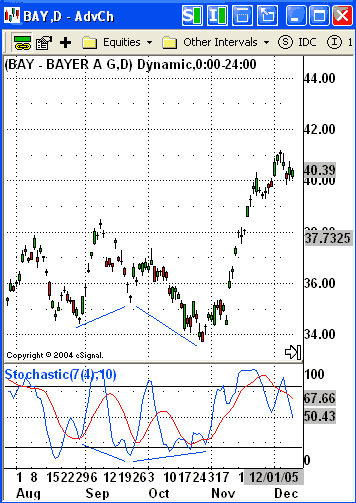
Figure 5: Bayer AG, Daily. Among the rarer of technical divergences, this sort of double divergence is different from typical multiple divergences that are essentially two or more orthodox divergences together. This variety shows two different types of positive or bullish divergence leading up to the sharp move to the upside. Ackerman wasn't kidding when he called this pattern "relatively rare." Scanning over stock movement over the last nine months in my various watchlists, I had a difficult time finding one that conformed exactly to Ackerman's specifications, as opposed to the more common, multiple divergences mentioned by Elder. What is shown in Figure 5 is my best effort, one that includes the top different types of divergences Ackerman discusses in his essay -- both of which leading into the "wicked turn" he suggests awaits those traders who accurately follow the clues such a market provides. DIVERGENCES AND DISCLAIMERS Every time I talk about technical divergences, I feel an almost moral obligation to remind readers that the best way to make money in the markets is to follow the trend. Whether you embrace the notion that the trend "is your friend until the end, when it bends," or prefer George Soros' well-known, cynical line about trends ("The object is to recognize a trend whose premise is false, ride that trend, and step off before it is discredited"), the fact of the matter is and will likely always remain that it is far easier and much more profitable to be a bull in a rising market and a bear in a falling market. Common sense? Sure. But the whipsaws of the market, the vagaries of sentiment, and the power of divergence analysis can be a perfect storm for the investor, trader, or speculator not tethered to an accurate sense of market environment. This environment includes everything from trend (upward, downward, sideways), cycles (early or late in a given trading cycle), and market mood (too much optimism or too much pessimism) and the skillful trader will incorporate much of this into his or her determination as to whether an uptrend should be analyzed for a potential top or a downtrend monitored for the possibility of a bottom -- and, perhaps, an excellent opportunity to buy. SUGGESTED READING Ackerman, Rick [2002]. "Stochastics Made Simple," RickAckerman.com. Edwards, Robert, and John Magee [1966]. Technical Analysis of Stock Trends, John Magee Inc. Elder, Alexander [2002]. Come Into My Trading Room, John Wiley & Sons. Murphy, John [1996]. The Visual Investor, John Wiley & Sons. |
Technical Writer for Technical Analysis of STOCKS & COMMODITIES magazine, Working-Money.com, and Traders.com Advantage.
| Title: | Traders.com Technical Writer |
| Company: | Technical Analysis, Inc. |
| Address: | 4757 California Avenue SW |
| Seattle, WA 98116 | |
| Phone # for sales: | 206 938 0570 |
| Fax: | 206 938 1307 |
| Website: | www.traders.com |
| E-mail address: | DPenn@traders.com |
Traders' Resource Links | |
| Charting the Stock Market: The Wyckoff Method -- Books | |
| Working-Money.com -- Online Trading Services | |
| Traders.com Advantage -- Online Trading Services | |
| Technical Analysis of Stocks & Commodities -- Publications and Newsletters | |
| Working Money, at Working-Money.com -- Publications and Newsletters | |
| Traders.com Advantage -- Publications and Newsletters | |
| Professional Traders Starter Kit -- Software | |
PRINT THIS ARTICLE

Request Information From Our Sponsors
- StockCharts.com, Inc.
- Candle Patterns
- Candlestick Charting Explained
- Intermarket Technical Analysis
- John Murphy on Chart Analysis
- John Murphy's Chart Pattern Recognition
- John Murphy's Market Message
- MurphyExplainsMarketAnalysis-Intermarket Analysis
- MurphyExplainsMarketAnalysis-Visual Analysis
- StockCharts.com
- Technical Analysis of the Financial Markets
- The Visual Investor
- VectorVest, Inc.
- Executive Premier Workshop
- One-Day Options Course
- OptionsPro
- Retirement Income Workshop
- Sure-Fire Trading Systems (VectorVest, Inc.)
- Trading as a Business Workshop
- VectorVest 7 EOD
- VectorVest 7 RealTime/IntraDay
- VectorVest AutoTester
- VectorVest Educational Services
- VectorVest OnLine
- VectorVest Options Analyzer
- VectorVest ProGraphics v6.0
- VectorVest ProTrader 7
- VectorVest RealTime Derby Tool
- VectorVest Simulator
- VectorVest Variator
- VectorVest Watchdog

