HOT TOPICS LIST
- Strategies
- Stocks
- Buy
- Investing
- Brokers
- Psychology
- Interviews
- Accumulate
- Sell
- Hold
- Spotlight
- Websites
- Candlestick Corner
- Gold & Metals
- Options Trading
LIST OF TOPICS
MARKET UPDATE
Wave Count 2006
04/26/06 04:47:00 PM PSTby David Penn
Flats and double threes, triangles and zigzags -- here's the latest look at the Standard & Poor's 500 through the lens of Elliott wave analysis.
| At times, Elliott wave theorists talk about a wave count having the correct "look." This means that before and after all of the analysis, the calculations, the channels, throwovers, and alternate counts, the final product of Elliott wave analysis should look reasonable to the eye. No need to let the perfect be the enemy of the good. But in the end, an accurate wave count will reflect some sort of harmony between what the arithmetic and geometry of Elliott wave theory insist and what the Elliottician can deduce. Writing on the subject, Robert Prechter and A.J. Frost note: The overall appearance of a wave must conform to the appropriate illustration. Although any five-wave sequence can be forced into a three-wave count by labeling the first three subdivisions as a single wave A ... it is incorrect to do so. Elliott analysis would lose its anchor if such contortions were allowed ... While the internal count of a wave is a guide to its classification, the right overall shape is, in turn, often a guide to its correct internal count. The case of the Standard & Poor's 500's cyclical bull market since the late 2002-early 2003 bottom is clearly an example of the former -- in which the smaller moves of the market have proved somewhat elusive to analysis when compared to the larger moves more visible on the weekly scale. This, unfortunately, does not resolve all of the complications that the wave count in this article introduces. But the enclosed wave count does go a long way toward mapping out the progress of equities -- and the overall improvement in social mood -- since the dark intrawar days of the autumn of 2002. At times, like everyone else, the Elliottician must pick his or her poison, choosing which of the various rules of Elliott wave analysis can be bent (preferably gently) in order to arrive at an overall assessment and wave count that is, in every other respect, helpful and consistent. |
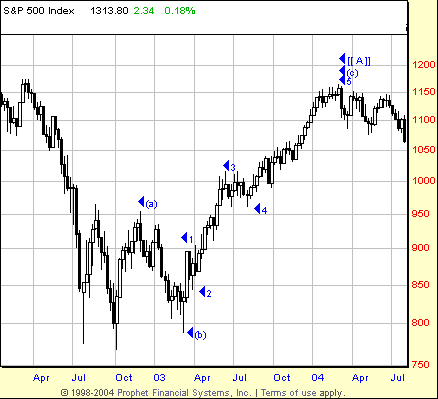
| FORM OF A FLAT If you believe that the top in 2000 was the end of a secular bull market that began in 1974 (or 1982, in inflation-adjusted terms), then it is likely that you believe that a secular bear market began that same year. The anticipated durations of secular bear markets vary, from the short and severe bear market of 1929-32 to the longer, relatively more benign bear market of 1966-74 (or 1982, factoring in inflation). If the number of years that a secular bear market can last is impossible to tell, then this conversation will assume that the current secular bear market consists of at least three stages. These stages include (but ultimately may not prove limited to) an initial decline, a countertrend "bounce," and a resumption of the previous declines as the market moves toward a bottom. Such a pattern would follow the sort of A-B-C pattern that is common with corrections and probably could provide sufficient downside for stock market valuations to return to the sort of truly oversold levels (as seen in 1932, 1938, 1974, and 1982 -- all significant bear market bottoms) that are required before new secular and cyclical bull markets can begin. I'm going to suggest as I have previously that the market from late 2002 to the present is a cyclical bull market within a secular bear market. This wasn't especially controversial a few years ago -- say, in 2004. But with a number of markets and indexes -- from the New York Stock Exchange to the Dow Jones Transportation Average -- making new, all-time highs, many have suggested instead that it was the decline from 2000 to late 2002 that was the cyclical move, and that the advance from the 2002 lows represented the beginning of a new secular bull market. Time, of course, will tell. But here I am going to maintain the thesis that the late 2002-present period represents a cyclical excursion into bullishness that won't be nearly as long-lasting as the previous secular excursion into bullishness that was the 1980s and 1990s. As a countertrend movement -- as all cyclical moves inside larger secular moves are -- I am going to posit an A-B-C pattern to the late 2002-present cyclical bull market. The first leg of this bull market, the A wave, appears to be further subdivided into three sections: an October-November 2002 rally, a November 2002-March 2003 correction, and a soaring March 2003-March 2004 advance. These subdivisions can themselves be labeled (a), (b), and (c).
Figure 1: Standard & Poor's 500, Weekly. The cyclical bull market that began in the autumn of 2002 is an A-B-C correction of the larger, secular bear market that began in 2000. Here is the first leg of that correction, shown as a 3-3-5 flat. |
What type of pattern does the A wave from October 2002 through March 2004 take? Unfortunately, wave A does not fit as nicely into a specific pattern as I would like. From all appearances, wave A has flat-like characteristics, yet the extension on the (c) part of the pattern makes the "flat" label problematic. First, what is a flat? Here is how the pattern is described by Frost and Prechter: A flat correction differs from a zigzag in that the subwave sequence is 3-3-5 ... Since the first actionary wave, wave (a), lacks sufficient downward force to unfold into a full five waves as it does in the zigzag, the (b) wave reaction, not surprisingly, seems to inherit this lack of counter-trend pressure and terminates near the start of wave (a). Beyond the specifics of the definition, the psychology that is embedded in this pattern (as with all chart patterns, Elliott wave or not) is worth noting. A flat is distinguished by a lack of overwhelming conviction on the part of buyers or sellers. Thus, the initial move that creates a wave (a) tends to be almost completely retraced by a subsequent wave (b). However, note how brief is the discussion of the third and final leg of the flat pattern: Wave (c), in turn, generally terminates just slightly beyond the end of wave (a) rather than significantly beyond as in zigzags. According to this, wave (c) falls prey to the same sort of meandering absence of conviction that waves (a) and (b) do. This is worth noting insofar as third waves -- of which wave (c) is one -- tend to be the most powerful wave in any sequence, whether that sequence is impulsive (in the direction of the cyclical or secular trend) or corrective (against the direction of the cyclical or secular trend). So a wave (c) that is no more prominent than a wave (a) or a wave (b) is in itself an odd circumstance, given what Elliotticians are told about third waves. Prechter and Frost seem to be aware of this when they describe a variation on the flat pattern that helps provide a far more robust wave (c) than is typically found in most flat patterns. They write: Far more common, however, is the variety we call an expanded flat, which contains a price extreme beyond that of the preceding impulse wave. Elliott called this variation an "irregular" flat, although the word is inappropriate as they are actually far more common than "regular" flats. The dilemma of an anemic third wave is solved here by making the second wave, the (b) wave more robust. The psychology behind this is that the pro-trend movement (which the second wave in an A-B-C pattern reflects) is so strong that buyers push the (b) wave farther along the corrective process than they would otherwise. This, however, is followed by an equally powerful selling reaction -- the final "giving up" en route to a real bottom. Insofar as (b) waves are, by Frost and Prechter's analysis, "phonies ... sucker plays, bull traps, speculator's paradise, orgies of odd-lotter mentality or expressions of dumb institutional complacency (or both)," it is little surprise that when the psychology that gives rise to a (b) wave fails, the reaction is swift and powerful in the other direction. This is part of what leads me to consider the bull market from October 2002 to March 2004 to be a flat. While there is nothing in the literature that corresponds perfectly with a market that has relatively equal (a) and (b) waves with an extended (c) wave that is literally the size of the (a) and (b) waves put together, it is hard for me to conclude that the October 2002 to March 2004 market is anything but a sort of expanded flat. This is even if the (b) wave into the early 2003 lows is not as oversized as Frost and Prechter tell us it should be. The clarity of the internal substructure of the waves: three waves in wave (a), three waves in wave (b), and five clear waves in wave (c) also lend credence to the notion that the pattern is a form of flat. |
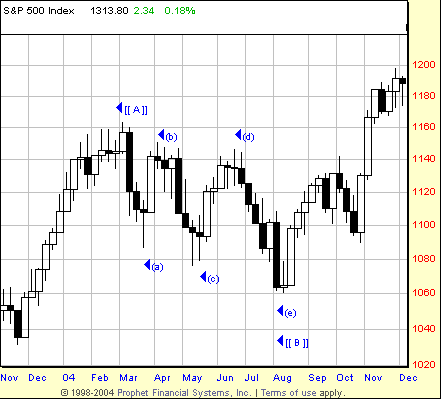
| EXPANDING ON TRIANGLES The year 2004 was a particularly tricky one to plot in Elliott wave terms. As is the case with much of Elliott wave analysis, what looks straightforward, even obvious, in hindsight is often arrived at only after many hours of furrowed brows and broken pencils. There was a powerful temptation to mark the March 2004 highs as "The Top" and the end of the countertrend, cyclical bull market, then a little over a year old, and at first it appeared as if the market would grant the bears their deepest darkest desires (namely, an S&P 500 that traded at 500). However, after the initial decline and rally into late March and early April 2004, it appeared as if the market was more resilient than many bears were prepared to believe. While there was a pattern of lower highs and lower lows clear into August 2004, the market felt more range-bound than preparing to collapse. This was especially so in the way that previous lows did not create the kind of resistance that would keep subsequent rallies low, and thus create the sort of stairstep down that true impulse (as opposed to corrective) markets create.
Figure 2: Standard & Poor's 500, Weekly. One of the more likely interpretations of the bear market from April 2004 to August 2004 is the expanding triangle. The expanding triangle consists of five waves, each of which is subdivided into three-segments. It now appears as if the middle of 2004 -- from March through August -- took the form of an expanding horizontal triangle. Corrective triangles such as this one have five points of reference generally labeled a-b-c-d-e and, like non-Elliott triangles, tend to reflect a decrease in volatility and volume. Let me point out that expanding triangles tend to reflect increasing volatility (at least relative to contracting triangles) insofar as the swings between the five reference points become wider and wilder as the pattern matures. This sort of chopping action gives rise to thoughts that perhaps the March-August 2004 market might have been a form of double 3. However, a double 3 needs at least seven reference points (labeled a-b-c-X-a-b-c), as opposed to five, as are found in all forms of the various Elliott triangles. Another argument in favor of the triangle interpretation comes from what Frost and Prechter suggest are a key attribute of such patterns: A triangle always occurs in a position prior to the final actionary wave in the pattern of one larger degree, i.e., as wave four in an impulse, wave B in an A-B-C, or the final wave X in a double or triple zigzag or combination ... Given the assumption that the cyclical bull market that began in the autumn of 2002 would be a three-segmented, A-B-C affair, and the likelihood that the March-August 2004 market was a correction rather than the resumption of the secular bear market, it was reasonable to expect that the final part of the A-B-C cyclical bull market, the wave C, might emerge from such a consolidation as a triangle. Recall again that the third wave in any sequence -- be it a corrective three-wave sequence or an impulse five-wave sequence -- tends to be the strongest, most robust leg of the journey. Insofar as some of the most powerful market moves often emerge from triangles, labeling the March-August 2004 market as a form of expanding triangle seems most consistent with both the internal structure of the March-August 2004 market, as well as the broader context of the cyclical bull market of which the March-August 2004 correction was a part.
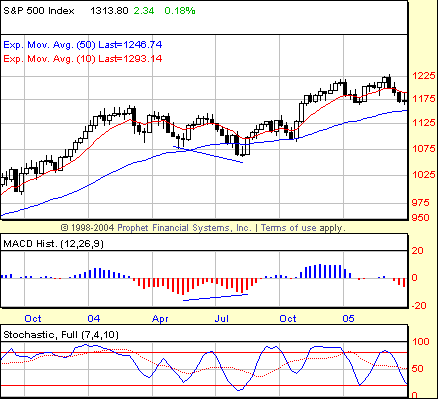
Figure 3: Standard & Poor's 500, Weekly. The positive divergence in the weekly MACD histogram was an excellent signal that the April 2004 to August 2004 bear market was coming to an end. A few technical points might also be worth noting. The August 2004 bottom was particularly well-telegraphed in both the daily and weekly charts. For all the analysis conducted in the study of markets, one of the most important concepts is what trader and market commentator Jack Steiman of Invested Central has referred to as "moments in time." Essentially, this concept means that there are instances in which it is quite literally "time to buy" or "time to sell," and half the art of trading is knowing when those instances are likely to occur and preparing yourself psychologically and materially to take advantage of them when they do. In this regard, there are a number of tools, from long-term technicals to seasonal tendencies and cycles, that traders and speculators can use to exploit these "moments in time." But a large part of the preparation is psychological. More often than not, times to buy can be bad or depressing times -- just as times to sell can often be joyous or complacent times. Going against the tide of social mood and the sentiment of the investing community is a lot easier said than done. In the case of the expanding triangle that was the March-August 2004 market, there was a positive moving average convergence/divergence (MACD) histogram divergence on the weekly chart that suggested an end to the correction had arrived. This positive MACD histogram divergence occurred between the lows of late May and the lows of mid-August, with lower lows in price matching higher lows in the histogram. As I have suggested elsewhere, I am more confident with MACD histogram divergences when they appear on weekly charts compared to when they appear on daily charts, when I defer to the stochastic. (Conversely, I find the stochastic I use less effective for spotting divergences in longer-term charts such as weeklies.) A similarly bullish signal was available to traders focusing on daily charts of the $SPX. And although here I am looking at the stochastic rather than the MACD histogram for the reasons just stated, we find that the daily chart shows a MACD histogram positive divergence as well as a positive divergence in the stochastic. In the daily charts, the divergence is between the lows of early and late July and those of mid-August 2004. In part 2 of this discussion, I will look at the third and final leg of the cyclical bull market: the C wave that began with the lows of August 2004. I'll also revisit some of the assumptions behind the wave count for the B wave as they are challenged by an alternative count for wave C. |
SUGGESTED READING ELWAVE User Manual, Prognosis Software Development. Frost, A.J., and Robert Prechter [1985]. Elliott Wave Principle, New Classics Library. |
Technical Writer for Technical Analysis of STOCKS & COMMODITIES magazine, Working-Money.com, and Traders.com Advantage.
| Title: | Traders.com Technical Writer |
| Company: | Technical Analysis, Inc. |
| Address: | 4757 California Avenue SW |
| Seattle, WA 98116 | |
| Phone # for sales: | 206 938 0570 |
| Fax: | 206 938 1307 |
| Website: | www.traders.com |
| E-mail address: | DPenn@traders.com |
Traders' Resource Links | |
| Charting the Stock Market: The Wyckoff Method -- Books | |
| Working-Money.com -- Online Trading Services | |
| Traders.com Advantage -- Online Trading Services | |
| Technical Analysis of Stocks & Commodities -- Publications and Newsletters | |
| Working Money, at Working-Money.com -- Publications and Newsletters | |
| Traders.com Advantage -- Publications and Newsletters | |
| Professional Traders Starter Kit -- Software | |
PRINT THIS ARTICLE

Request Information From Our Sponsors
- VectorVest, Inc.
- Executive Premier Workshop
- One-Day Options Course
- OptionsPro
- Retirement Income Workshop
- Sure-Fire Trading Systems (VectorVest, Inc.)
- Trading as a Business Workshop
- VectorVest 7 EOD
- VectorVest 7 RealTime/IntraDay
- VectorVest AutoTester
- VectorVest Educational Services
- VectorVest OnLine
- VectorVest Options Analyzer
- VectorVest ProGraphics v6.0
- VectorVest ProTrader 7
- VectorVest RealTime Derby Tool
- VectorVest Simulator
- VectorVest Variator
- VectorVest Watchdog
- StockCharts.com, Inc.
- Candle Patterns
- Candlestick Charting Explained
- Intermarket Technical Analysis
- John Murphy on Chart Analysis
- John Murphy's Chart Pattern Recognition
- John Murphy's Market Message
- MurphyExplainsMarketAnalysis-Intermarket Analysis
- MurphyExplainsMarketAnalysis-Visual Analysis
- StockCharts.com
- Technical Analysis of the Financial Markets
- The Visual Investor


