

HOT TOPICS LIST
- Strategies
- Stocks
- Buy
- Investing
- Brokers
- Psychology
- Interviews
- Accumulate
- Sell
- Hold
- Spotlight
- Websites
- Candlestick Corner
- Gold & Metals
- Options Trading
LIST OF TOPICS
SECTOR SPOTTING
Counting On Consumers
05/01/06 02:53:40 PM PSTby David Penn
As an economy moves from expansion to contraction, savvy investors move from smokestacks to cupboards and cabinets.
Back in November 2005 I wrote a short article for Traders.com Advantage that considered the prospects for "smokestack" stocks ("Smoke Rising?" November 16, 2005). Smokestack stocks is another way of referring to industrial cyclicals: those heavy industry, basic materials-related manufacturing and processing companies that tend to outperform when an economy is running on all cylinders. The point of the article -- which, although reprinted in our tabloid publication, Traders.com, was originally slated to be a significantly longer piece -- was twofold: one, to point out the relevance of the business/economic cycle from early expansion to late contraction, and two, to highlight the location of the smokestack stocks, the industrial cyclicals, within the cycle. At the same time, there was a line in that article that should be emphasized for this conversation about consumer staples, those companies for which demand for their goods and services is relatively constant, regardless of the state of the business cycle. I wrote: It is worth remembering that this is truly a cycle. So some aggressive investors will look to bid up technology stocks, for example, late in an economic contraction. As technology stocks start to fade, some investors and speculators will begin to explore bargain opportunities in the materials and energy sectors -- sectors that tend to do well with the inflation that accompanies economic expansion, especially in its late stages. At the time, the objects of this observation were the then-dormant smokestack stocks. But back in the autumn of 2005, the promise of market returns from this group was hardly assured. Here in the late spring of 2006, it is easy to see these stocks as a source of investing joy. Of the two smokestack stocks highlighted in "Smoke Rising?" from November 2005, Air Products and Chemicals, at the time of that article trading at $58, has rallied to a recent close of more than $69. Even more impressive, US Steel has rallied from $39 a share to almost $70 here in late April. Using the same sort of logic that drew me to the smokestack stocks back in November 2005, I wanted to take a look at consumer staples stocks in the spring of 2006. With record highs in commodities like gold, titanium, and copper (to say nothing of silver!), and the fortunes of oil companies a subject of casual everyday conversation among market and nonmarket savvy folk alike, the possibility commodity-oriented stocks might be peaking seemed worth investigating. But rather than focus on the possibility of the curtain closing on smokestack stocks, I thought it might be more interesting -- and potentially more rewarding -- to focus on those stocks that may be just about ready to take center stage. STAPLE ARGUMENTS
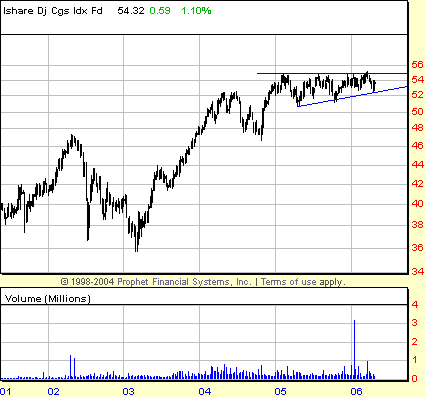
FIGURE 1: DOW JONES US CONSUMER GOODS SECTOR INDEX FUND, WEEKLY. Consumer goods stocks have traded in a consolidation range since early 2005. The horizontal resistance and series of higher lows since the spring of 2005 hint at an ascending triangle that could support a strong move to the upside in the stocks of this group. |
| On the other hand, when stocks are broadly out of favor, those who still believe their money is better invested in stocks than stored away in money market funds, bonds, and certificates of deposit will often seek out consumer staples stocks for the same sort of stability that was shunned only a few turns of the business cycle ago. Because instances when stocks are broadly out of favor tend to coincide with times when the economy is barely growing or in recession, the fact that people still have to buy food or bandages or household cleaning products or alcoholic beverages serves as a powerful incentive for many investors to load up on shares of those companies whose products people can typically find in kitchen cupboards and bathroom cabinets. Specifically, what industries are we talking about? The consumer staples sector (see Figure 1) includes everything from tobacco, medical products, cosmetics, food, and beverages (alcoholic and soft drink), all the way to health care and pharmaceuticals in general. Just a list of the industries that make up this sector provides a good sense of the sort of companies we are talking about when we talk about consumer staples. And the fact that few of these industries have been on the lips of market commentators in recent months is one reason why investors looking for the Next Big Thing in stocks may be turning their attention toward consumer staples. EATS AND DRINKS Many of the stocks in these industries have made aggressive moves to the upside in recent weeks. Specifically for a number of food and beverage stocks, mid-April seemed to be a point at which many of them either ended pullbacks in bullish trends and resumed upward movement, or ended more sizable corrections in bearish trends and showed signs of reversing to the upside. Whether or not mid-April 2006 will serve as the same sort of moment that occurred in the autumn of 2005 to unleash the smokestack stocks remains to be seen. But the reaction of many of these otherwise often moribund stocks on or around the ides of April was certainly noteworthy.
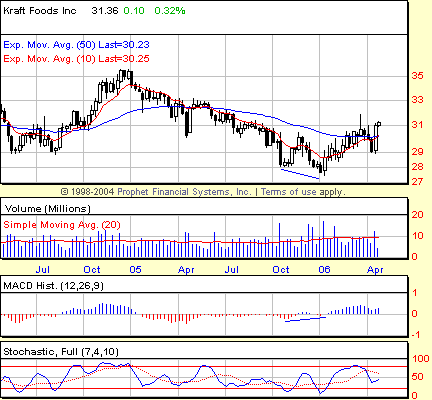
FIGURE 2: KRAFT, WEEKLY. A bear market over the course of 2005 cleared the decks for buyers to enter in early 2006. |
| One interesting example of this can be seen in Kraft (KFT). Kraft shares topped out in late 2004 after breaching the $36 level (Figure 2). The stock spent virtually all of 2005 falling, even as the broader market was rallying (albeit fitfully at times). However, in December 2005, KFT made a lower weekly low that was unconfirmed by a lower low in the moving average convergence/divergence (MACD) histogram. This, combined with the fact that the stock had already spent fully a year in a bear market that saw its price slip more than 20%, suggested that a bottom of at least intermediate degree was being established. Since that time, KFT has moved up from 28 to as high as 32 in recent trading. The progress of Molson/Coors (TAP) shows the reaction of consumer staples stocks to the ides of April as well. Unlike Kraft, TAP was in an uptrend throughout 2005 and thus entered 2006 with the wind at its back. An initial selloff in January led to a bottom in February and a rally that lasted until late March. Then, a milder selloff that began in late March lasted until mid-April, when Molson/Coors, like its peers, caught a bid and bounded significantly higher. As of this writing, TAP is testing 52-week highs.
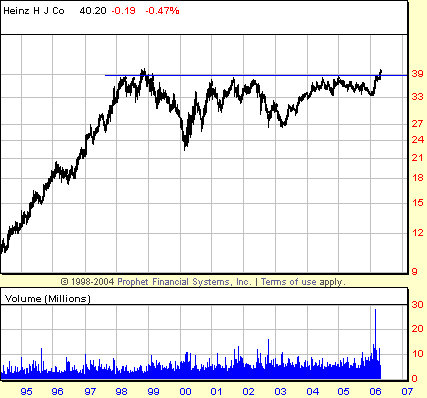
FIGURE 3: HEINZ, WEEKLY. Shares of Heinz spent the past several years in a consolidation range that looks intriguingly like a cup with handle pattern. Could a run on consumer staples stocks push Heinz to $50? |
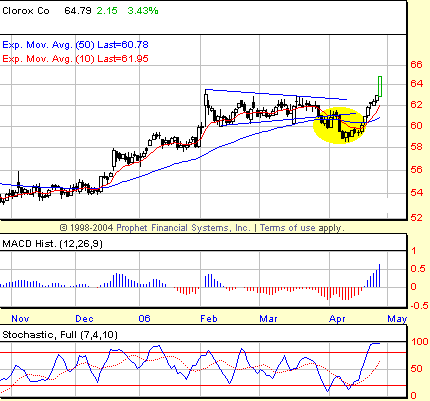
| Similarly impressive progress can be found in another consumer staple from the food and beverage group: Heinz (Figure 3). A stock that was maligned as much for its mediocre performance in recent years as for the outspoken personality of Heinz heiress Teresa Heinz Kerry, wife of 2004 Democratic Presidential nominee John Kerry, HNZ is currently having the last laugh, as its recent experience with the ides of April in 2006 has helped launch the stock to all-time highs. In fact, looking at a long-term chart of HNZ going back some 12 years reveals not so much a stock that hasn't gone anywhere in much too long, but more a stock that has been in a cup with handle consolidation and could be ready to bound higher. HOME IS WHERE THE STOCKS ARE Clorox is another picture-perfect example of what appears to have been a key low in consumer staples stocks that occurred in mid-April. As Figure 4 shows, CLX was in a triangular consolidation from February 2006 through March. While the moving average convergence/divergence (MACD) histogram peak early in the pattern suggested that the February highs would be exceeded, the relatively symmetrical nature of the triangle meant that a breakdown was almost as likely as a breakout. Just as March was ending, it appeared as if the buyers and sellers in CLX had made up their minds and the sellers were going to carry the day. But after a short breakdown that saw the stock slip from a breakdown level of 61 to about 59, CLX found support and dramatically reversed course. Closing at about 59.5 on April 13, Clorox rallied some 8% to more than 64 within two weeks. This move not only set a new year-to-date high, but also brought the stock to a new, all-time high.
FIGURE 4: CLOROX, DAILY. A false breakdown from a symmetrical triangle in late March-early April leads to a reversal and a rally to all-time highs. |
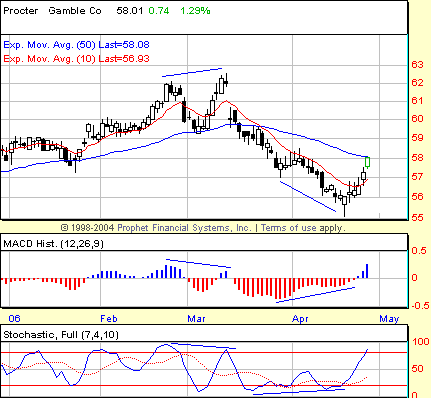
| In contrast to some of these consumer staples stocks that are making major new highs, even those consumer staples stocks that have fallen on particularly hard times appear to be benefiting from a change in sentiment -- or perhaps just some cagey early bids toward these stocks as a whole. One solid example of this phenomenon might be Procter & Gamble (Figure 5). PG was in rally mode going into March 2006 when the stock topped and began falling sharply. From a high just north of 62 on March 10, PG slid for the next four weeks to an April low close of about 56 for a 10% loss in about a month. However, in the same way that PG's decline was telegraphed by negative divergences in both the stochastic and the MACD histogram, the stock's bounce in mid-April appears to have been similarly anticipated by the stochastic and MACD histogram -- both of which developed positive divergences between the March and April lows. Again, even though PG was in a bearish trend, it responded the same way as some of its more high-flying mates when the ides of April came %91round.
FIGURE 5: PROCTER AND GAMBLE, DAILY. The divergences taketh and giveth in shares of PG. The March-April positive divergences were a strong signal that the 10% correction in PG that began in March likely was coming to an end. STRONG STOCKS, WEAK DOLLAR? Again, context is key. Consumer staples do well at the beginning of the contraction (or early contraction) stage of the business cycle. What sort of economy is present immediately before a contraction begins? Based on the outperformance of basic materials and energy stocks in the preceding stage of the business cycle, we would have to conclude that consumer staples stocks will begin to emerge as inflationary pressures have become clearly manifest throughout the economy. It is the appearance of inflation -- witnessed by soaring commodity prices and outperforming commodity and smokestack stocks -- that results from the weaker dollar. And the efforts to fight these signs of inflation with tighter monetary policies (that is, Fed funds rate increases) helps bring about the contraction stage of the business cycle. This, as the saying goes, is where the consumer staples stocks come in. Consider the economic conditions of the early contraction stage as enumerated by Sam Stovall: sharply falling consumer expectations, declining industrial production, inflation that is "rising less strongly," peaking interest rates, and a flattened or even inverted yield curve. I would argue that by the time all of these factors and conditions are present, we are well on our way out of the "early" part of the contraction and moving quickly toward the "late" part of the contraction, during which precious few sectors or industries can be expected to perform well. For the present, however, the performance of the consumer staples stocks remains an excellent indicator of where we might be in the business cycle and of what investors, speculators, and traders might be able to reasonably expect from equities and the economy in general. SUGGESTED READING |
Technical Writer for Technical Analysis of STOCKS & COMMODITIES magazine, Working-Money.com, and Traders.com Advantage.
| Title: | Traders.com Technical Writer |
| Company: | Technical Analysis, Inc. |
| Address: | 4757 California Avenue SW |
| Seattle, WA 98116 | |
| Phone # for sales: | 206 938 0570 |
| Fax: | 206 938 1307 |
| Website: | www.traders.com |
| E-mail address: | DPenn@traders.com |
Traders' Resource Links | |
| Charting the Stock Market: The Wyckoff Method -- Books | |
| Working-Money.com -- Online Trading Services | |
| Traders.com Advantage -- Online Trading Services | |
| Technical Analysis of Stocks & Commodities -- Publications and Newsletters | |
| Working Money, at Working-Money.com -- Publications and Newsletters | |
| Traders.com Advantage -- Publications and Newsletters | |
| Professional Traders Starter Kit -- Software | |
PRINT THIS ARTICLE

Request Information From Our Sponsors
- StockCharts.com, Inc.
- Candle Patterns
- Candlestick Charting Explained
- Intermarket Technical Analysis
- John Murphy on Chart Analysis
- John Murphy's Chart Pattern Recognition
- John Murphy's Market Message
- MurphyExplainsMarketAnalysis-Intermarket Analysis
- MurphyExplainsMarketAnalysis-Visual Analysis
- StockCharts.com
- Technical Analysis of the Financial Markets
- The Visual Investor
- VectorVest, Inc.
- Executive Premier Workshop
- One-Day Options Course
- OptionsPro
- Retirement Income Workshop
- Sure-Fire Trading Systems (VectorVest, Inc.)
- Trading as a Business Workshop
- VectorVest 7 EOD
- VectorVest 7 RealTime/IntraDay
- VectorVest AutoTester
- VectorVest Educational Services
- VectorVest OnLine
- VectorVest Options Analyzer
- VectorVest ProGraphics v6.0
- VectorVest ProTrader 7
- VectorVest RealTime Derby Tool
- VectorVest Simulator
- VectorVest Variator
- VectorVest Watchdog